Figure 1.
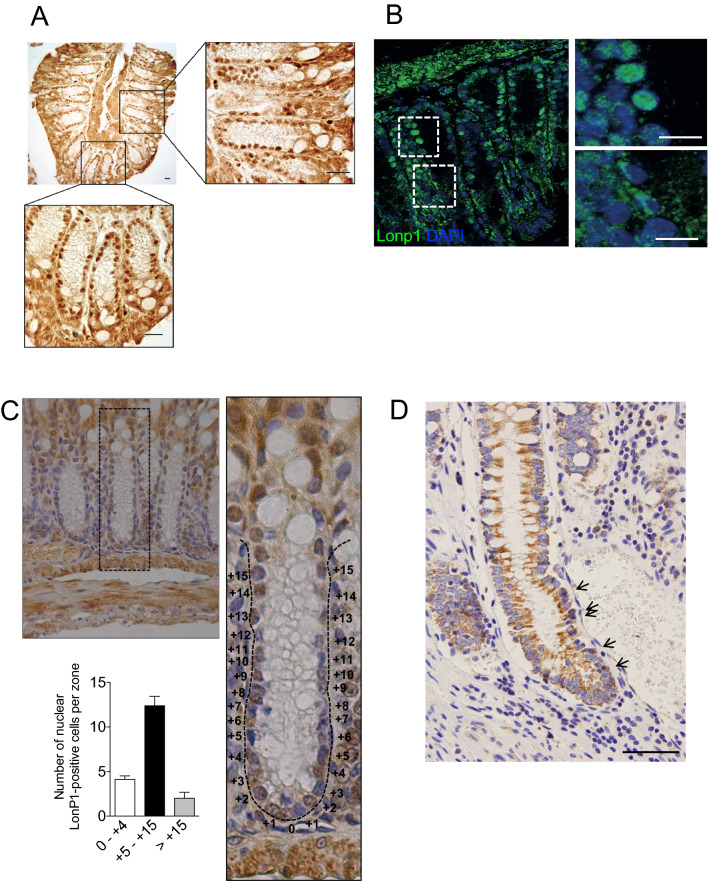
Lonp1 localizes in the nuclei of mouse colon tissue and human colon tissue. (A) Representative images of Lonp1 IHC on murine colon tissue, showing Lonp1 nuclear localization. (B) Representative images of Lonp1 IF on murine colon tissue, showing Lonp1 nuclear localization. Nuclei were counterstained with DAPI. (C) Representative Ki-67 IHC staining in intestinal crypt. Cells of the crypt were sectioned into three zones: the lower (0 to + 4), upper (+ 5 to + 15), and non (> + 15)-crypt zones. The histogram represents the percentage of cells with nuclear Lonp1 per crypt zone (n = 10 crypts per group). Data represent the mean ± SD. (D) Representative images of Lonp1 IHC on human colon tissue, showing Lonp1 nuclear localization (arrows). Bar: 200 µm.

