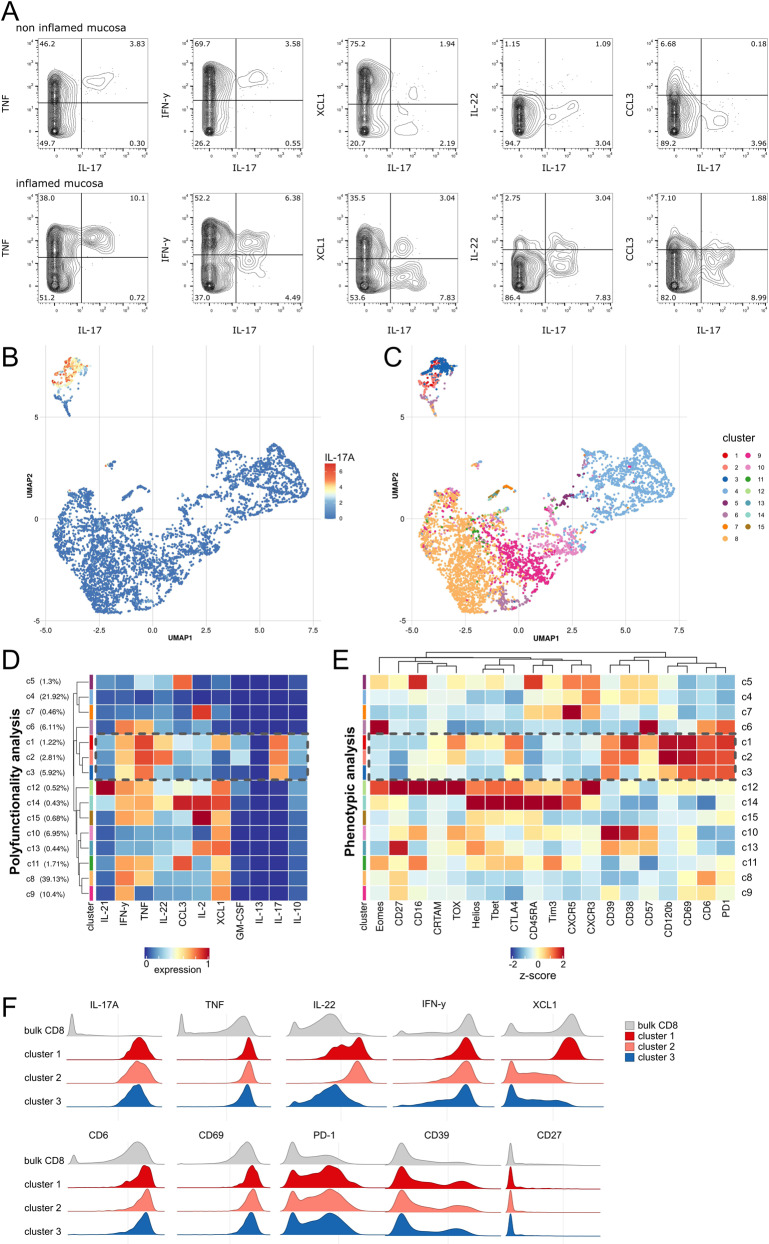
Fig. 2. High dimensional mass cytometry analysis reveals a signature of IL-17 producing CD8+ T cells.
A Representative mass cytometry plots gated on CD8+ T cells depict production of TNF, IFN-γ, XCL1, IL-22 and CCL3 plotted versus IL-17 of live singlet CD45+ CD3+ CD8+ T cells in the intestinal mucosa of a CD patient with proximal inflammation (n = 1646 and n = 690 CD8+ T cells in non-inflamed vs. inflamed mucosa, respectively). B UMAP analysis and FlowSOM clustering of the functional CD8+ T cell landscape from 6 CD biopsies were calculated on total n = 27768 CD8+ T cells based on IL-21, IFN-γ, TNF, IL-22, CCL3, IL-2, XCL1, GM-CSF, IL-13, IL-17 and IL-10 expression. IL-17 expression (B) and FlowSOM clusters (C) are indicated by color scheme. D Functional characteristics of FlowSOM clusters of intestinal CD8+ T cells are indicated by heatmap. Color scheme depicts arcsinh-transformed expression values scaled between 0.01 and 0.99 quantile. Hierarchical clustering was performed on unscaled data. Dashed box indicates the Tc17 clusters. E FlowSOM clusters were manually gated for expression of phenotypic markers and hierarchical clustering was performed on expression data. Frequency of positive populations per cluster is displayed by z score. F Histograms depict functional (top) and phenotypic (bottom) markers of clusters c1, c2 and c3 and bulk CD8+ T cells.

