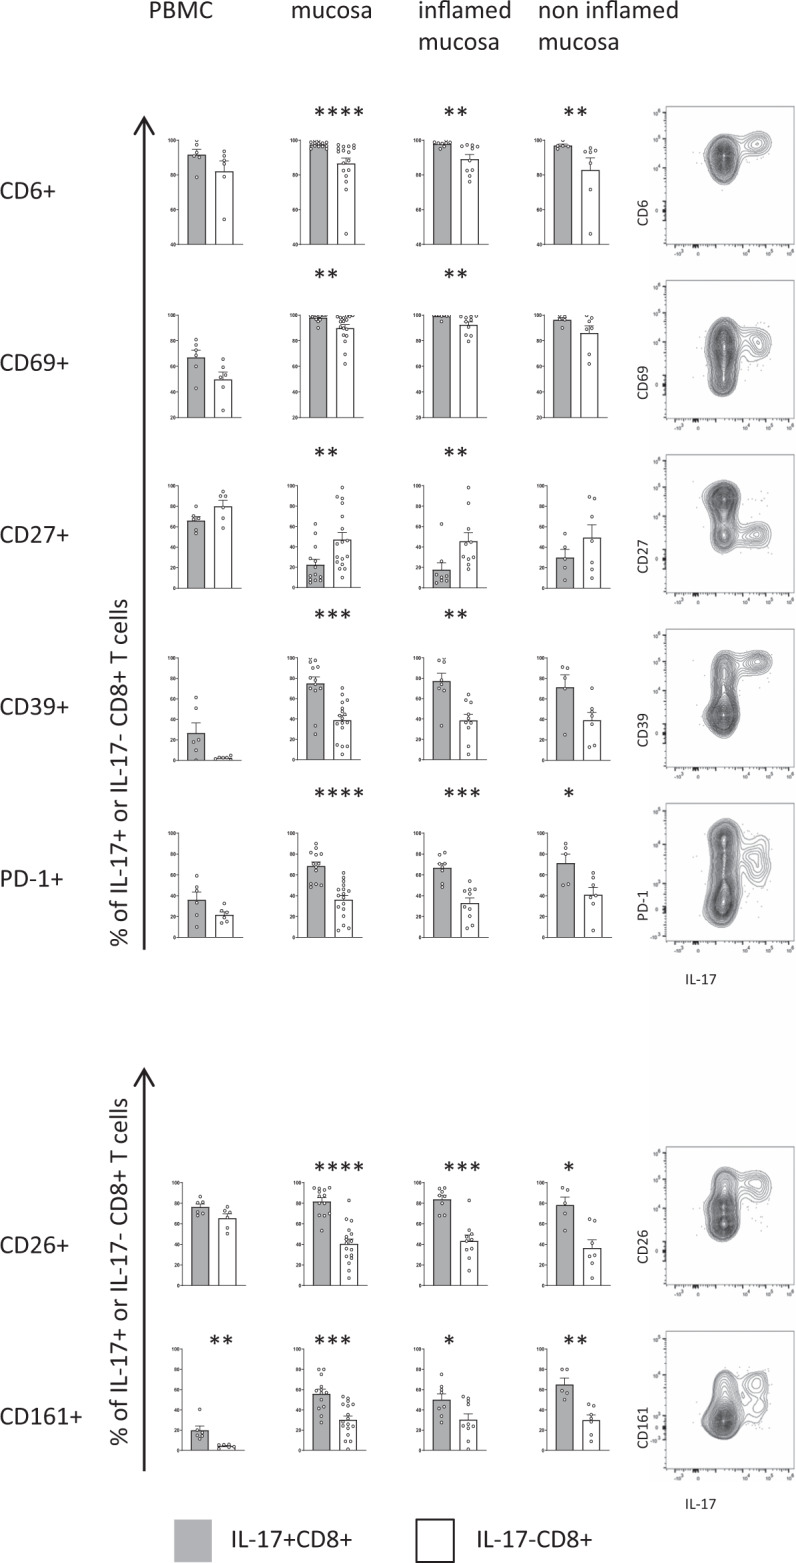
Fig. 3. Flow cytometric validation of the Tc17 signature in an independent cohort of CD patients.

The expression of phenotypic IL-17 signature markers in CD8+ T cells after PMA/ionomycin stimulation was compared between IL-17 producing (grey) and non-IL-17 producing CD8+ T cells (white) from peripheral blood (n = 6) and intestinal mucosa (n = 17) and analyzed based on endoscopic inflammation: inflamed mucosa (n = 10) and non-inflamed mucosa (n = 7). (Right) Representative FACS plots of signature markers versus IL-17 production by CD8+ T cells isolated from an inflamed mucosal sample of a CD patient. Data are presented as mean +/− SEM. Statistical tests used were two-sided. ****p < 0.0001, ***p < 0.001, **p < 0.01, *p < 0.05.
