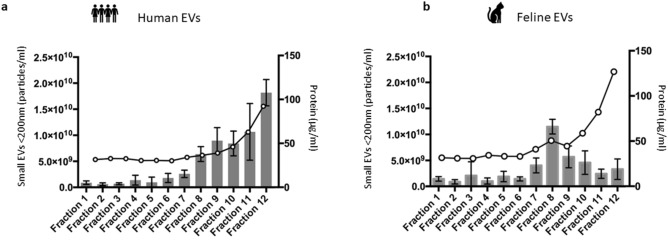
Figure 2.
Nanoparticle tracking analysis (NTA) of the number of small EVs (< 200 nm) in each fraction isolated from the plasma of (a) humans and (b) felines by SEC. Protein concentration (-0-) of each fraction isolated by SEC from the plasma of (a) humans and (b) felines by BCA. (a) The enrichment of small EVs in human plasma within fractions 7–10 is shown. The protein concentration also increases in later fractions, with fractions 11 and 12 containing substantially more protein than previous fractions. (b) The enrichment of small EVs in feline plasma within fractions 7–10 is shown. The protein concentration increases in later fractions, with fractions 11 and 12 containing substantially more protein than previous fractions. This figure confirms that the majority of small EVs are contained in fractions 7–10, while fractions 11 and 12 from both human and feline plasma contain substantially more co-isolated contaminating protein than previous fractions. A high protein to particle ratio has been shown to indicate contamination by plasma proteins5.

