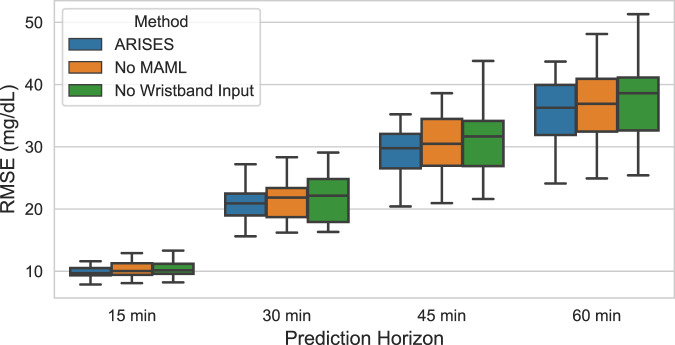
Fig. 3. Ablation analysis on the prediction performance of glucose levels.
The model achieved smaller average RMSE for the 12 T1D subjects when using MAML and wristband input data. The improvement is most significant for the 60-minute prediction horizon. The lower and upper hinges of boxplots show the first quarter (Q1) and the third quartile (Q3), respectively. The central lines indicate the median, while the whiskers extend to 1.5 IQR.

