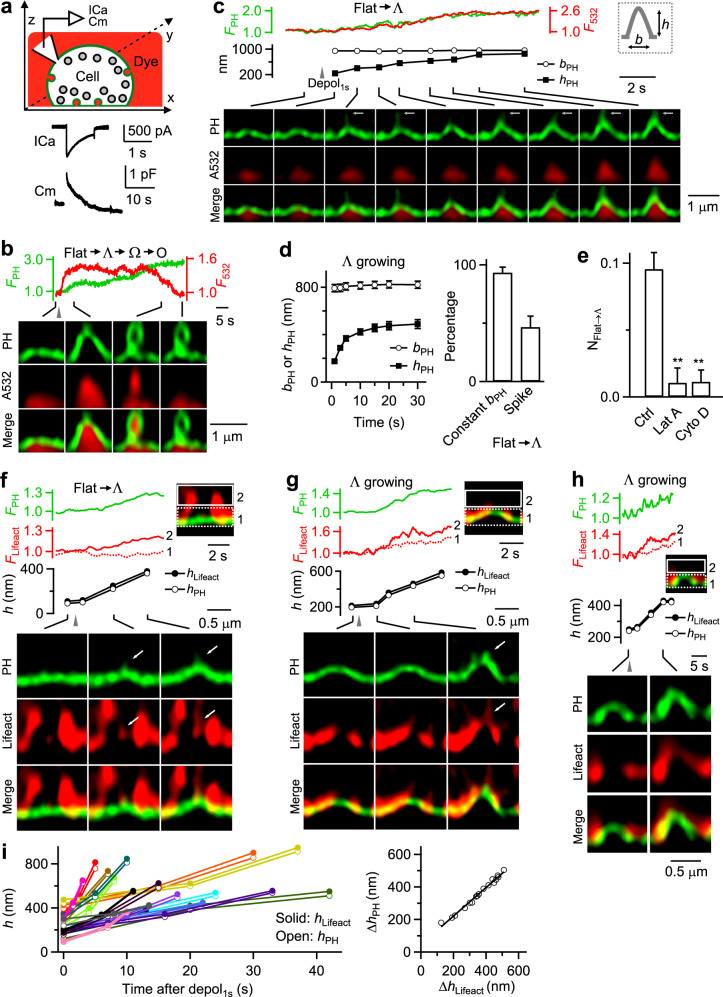
Fig. 1. Actin filaments in mediating Flat→Λ in chromaffin cells.
a Upper: setup drawing – a PHG-labeled cell (green) in A532-containing bath (red) with whole-cell recording of calcium currents (ICa) and capacitance (Cm). x, y and z: microscopic axis. Lower: sampled ICa and Cm induced by depol1s. b PHG fluorescence (FPH, normalized to baseline), A532 fluorescence (F532, normalized to baseline), and STED XZ/Yfix images (at times indicated with lines) showing Flat→Λ→Ω→O transition induced by depol1s (gray triangle). Distinguishing Ω from O is described Fig. 6 and the corresponding main text. c FPH, F532, PHG-labeled Λ’s height (hPH) and base (bPH, see also inset) and XZ/Yfix images (at times indicated with lines) showing Flat→Λ transition induced by depol1s (gray triangle). White arrows point to thin tube-shape protrusions that may be caused by a pulling force. d Left: Λ’s hPH and bPH plotted versus time during Flat→Λ (mean ± SEM, 30 cells from 27 cultures; 54 bovines). bPH was not measured when hPH was <20% of the peak. Right: percentage of Flat→Λ transition with a constant base (bPH change <20%) or with thin tube-like protrusion at growing Λ’s tip (Flat→Λ transitions; 30 cells from 27 cultures; 54 bovines). e The number of Flat→Λ transitions per 10 μm membrane along X-axis during XZ/Yfix scanning (NFlat→Λ) in control (Ctrl, 513 cells from 168 cultures; 336 bovines), and in the presence of latrunculin A (Lat A, 3 μM, 20–30 min, 61 cells from 15 cultures; 30 bovines; p = 0.005), or Cytochalasin D (Cyto D, 4 μM, 20–30 min, 57 cells from 12 cultures; 24 bovines; p = 0.006). **p < 0.01 (two-tailed unpaired t-test, compared to Ctrl). Data are presented as mean + SEM. f–h FPH, lifeact-mTFP1 fluorescence (Flifeact), PHG-labeled Λ’s hPH, the highest position of lifeact-mTFP1-labeled F-actin associated with Λ (hlifeact), and sample XZ/Yfix images showing F-actin filament recruitment, attachment at, and movement with the growing Λ’s tip during Flat→Λ (f) or growing of Λ (g, h). Flifeact from regions 1 (near Λ’s base) and 2 (above Λ’s base, inset) are plotted. f, g Spike-like protrusion attached to growing F-actin filaments (arrows). h F-actin association with Λ’s tip, side and base. hPH and hlifeact were measured as the height from the PHG-labeled base membrane. i Left: hPH and hlifeact (h) measured during Λ growing plotted versus time after depol1s (each colour: one Λ growing event). Right: the increase of hPH (ΔhPH) plotted versus the increase of hlifeact (Δhlifeact, left) during Λ growing (each symbol: one Λ growing event). The line is a linear regression fit. Source data are provided as a Source Data file.

