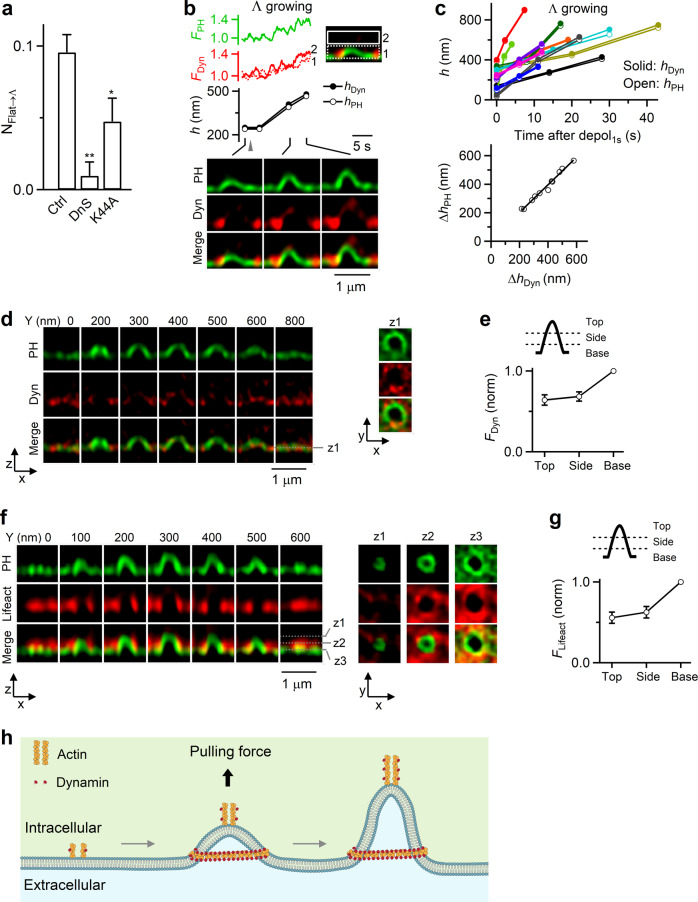
Fig. 3. Dynamin in mediating Flat→Λ in chromaffin cells.
a NFlat→Λ in control (Ctrl, 513 cells from 168 cultures; 336 bovines), in the presence of dynasore (DnS, 80 μM, bath, 20–30 min, 64 cells from 13 cultures; 26 bovines; p = 0.003), or with overexpressed dynamin 1-K44A (Dyn-K44A, 106 cells from 21 cultures; 42 bovines; p = 0.039). *p < 0.05; **p < 0.01 (two-tailed unpaired t-test, compared to Ctrl). Data are presented as mean + SEM. b FPH, dynamin 1-mTFP1 fluorescence (FDyn), PHG-labeled Λ’s hPH, the highest point of dynamin 1-mTFP1 fluorescence associated with Λ (hDyn), and sample XZ/Yfix images showing recruitment of dynamin while Λ is growing. FDyn from region 1 and 2 (inset) are plotted. hPH and hDyn were measured as the height from the PHG-labeled base membrane. c Upper: hPH and hDyn (h) plotted versus time after depol1s when Λ was growing. Each color represents one Λ growing event (11 events). Lower: the increase of hPH (ΔhPH) plotted versus the increase of hDyn (ΔhDyn, left) for each Λ growing event (11 events). The line is a linear regression fit. d Dynamin surrounds Λ: XZ images of PHG and Dyn (dynamin 1-mTFP1) along Y-axis every 100–200 nm as labeled; XY images at a Z-axis location (z1, dotted line) are also shown (right). e FDyn at Λ’s base, side and top region (see drawings; 24 Λ; from 17 cells, 4 cultures, 8 bovines). FDyn is normalized (norm) to that at the base. Data are presented as mean ± SEM. f F-actin surrounds Λ: XZ images of PHG/lifeact-mTFP1 (green, red and merge) along Y-axis every 100 nm; XY images at 3 Z-axis locations (z1, z2, z3, and dotted lines) are also shown (right). g Lifeact-mTFP1 fluorescence (Fliefact) at the base/pore, side, and top region (see drawings) of Λ (18 Λ; from 13 cells, 3 cultures, 6 bovines). Flifeact is normalized (norm) to that at the base/pore region. Data are presented as mean ± SEM. h Schematic drawing: actin and dynamin mediate Flat→Λ by generating a pulling force at the center and the growing Λ’s tip, and by surrounding Λ’s base. Source data are provided as a Source Data file.

