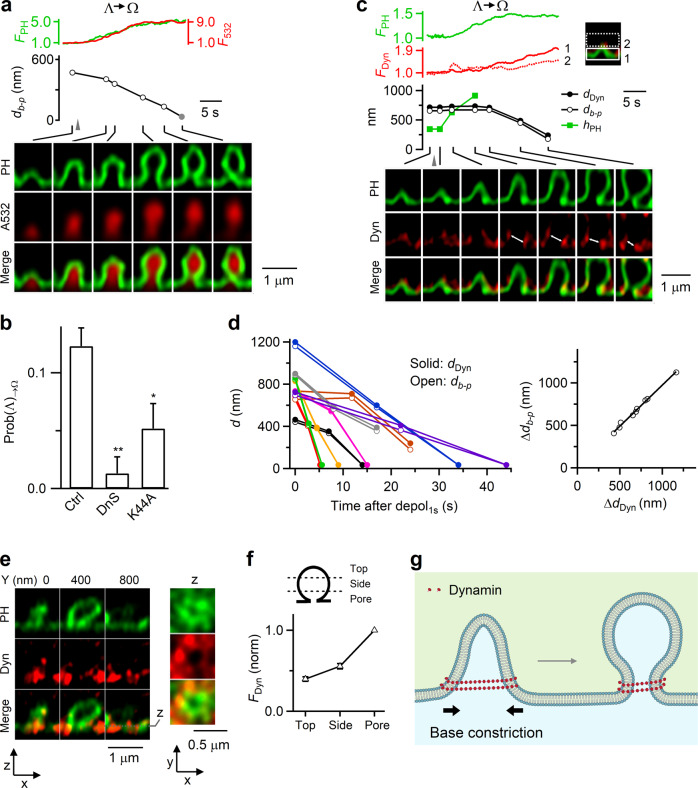
Fig. 4. Dynamin mediates Λ→Ω by surrounding and constricting Λ’s base in chromaffin cells.
a FPH, F532, Λ’s base distance or Ω’s pore diameter (db-p), and XZ/Yfix images (at times indicated with lines) showing db-p constriction during Λ→Ω. Gray triangle, depol1s. Gray circle: <60 nm (STED resolution). b Inhibition of dynamin reduces Λ→Ω transition: Prob(Λ)→Ω in control (Ctrl, 513 cells from 168 cultures; 336 bovines), in the presence of dynasore (DnS, 64 cells from 13 cultures; 26 bovines; p = 0.007), overexpressed dynamin 1-K44A (Dyn-K44A, 106 cells from 21 cultures; 42 bovines; p = 0.032). *p < 0.05; **p < 0.01 (two-tailed unpaired t-test, compared to Ctrl). Data are presented as mean + SEM. c Dynamin puncta flanked and moved with constricting Λ’s base and constricting Ω’s pore: FPH, FDyn, Λ’s base distance or Ω’s pore diameter (db-p), the distance between two dynamin puncta flanking Λ/Ω’s base/pore (dDyn, double arrows), and sample XZ/Yfix images of PH/dynamin for a Λ→Ω transition. FDyn (normalized) from region 1 (near Λ/Ω base) and 2 (above base, inset) are plotted. d Left: db-p and dDyn (d) plotted versus time after depol1s during Λ→Ω transition. Each color: one event (9 events). Right: the decrease of db-p (Δdb-p) plotted versus the decrease of dDyn (ΔdDyn) observed during Λ→Ω transition (each circle: one transition, 9 transitions). The line is a linear regression fit. e Dynamin surrounds Ω’s pore region: XZ images of PHG and Dyn (dynamin 1-mTFP1) for a Ωp along Y-axis every 400 nm as labeled; XY images at the Z-axis location, z (dotted line), are also shown. f FDyn at the pore, side and top region of Ω (see drawings, 67 Ω; from 17 cells, 4 cultures, 8 bovines). FDyn is normalized (norm) to that at the pore region. g Schematic drawing: dynamin surrounds and constricts Λ’s base, converting Λ to Ω. Source data are provided as a Source Data file.

