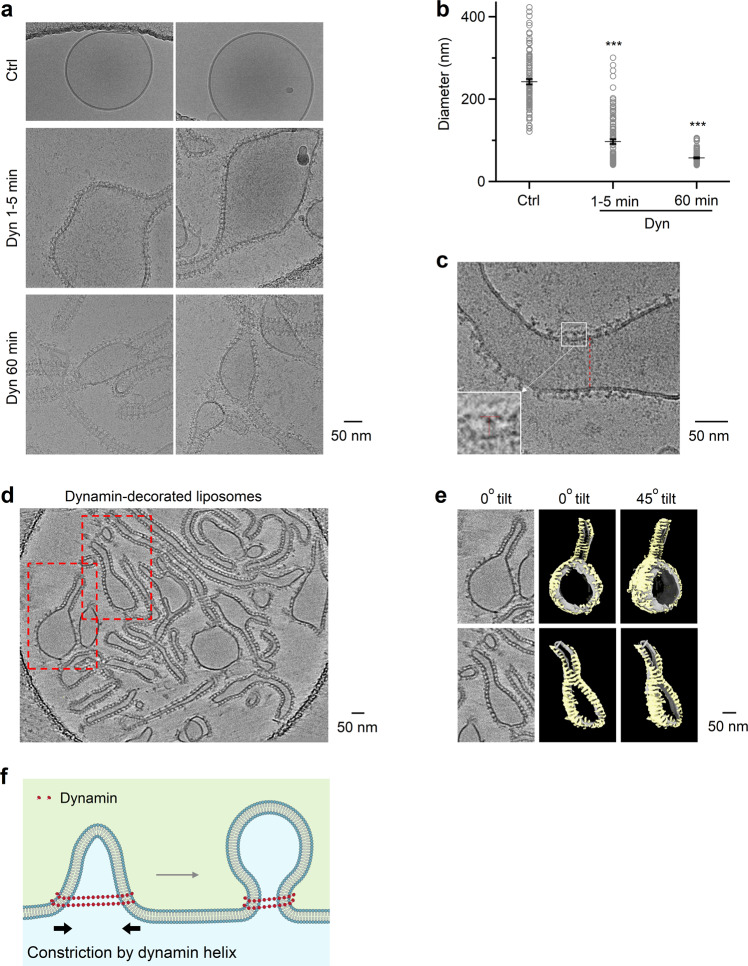
Fig. 5. Dynamin helix reduces liposome size in vitro.
a, b Sampled cryoEM images (a) and diameter (b) mean ± SEM) of DOPS vesicles coated without (Ctrl, n = 104) or with dynamin 1 after dynamin 1 incubation for 1-5 min (Dyn 1-5 min, n = 104, p = 6.75 × 10−39) or 60 min (Dyn 60 min, n = 104, p = 5.82*10−70). ***p < 0.001, two-tailed unpaired t-test (compared to Ctrl); each circle represents a liposome (104 micrographs from 3 independent experiments). c Dynamin 1 assembled around large liposomes. The regular pattern of dynamin as ‘T’ structures on the edge of the lipid bilayer (insert) and the striation pattern seen on the lipid (dotted red line) suggests dynamin is wrapping around the lipid as a helix. d Cryo-electron tomogram of dynamin 1 with DOPS vesicles. Several dynamin-decorated vesicles and tubes are apparent with the characteristic T-shaped structure of dynamin extending from the membrane. Red-dashed boxes indicated two regions of the tomogram that were segmented as shown in panel (e). e CryoET segmentation of two DOPS vesicles with diameters of ~166 nm (top) and ~85 nm (bottom). Left panels, central slice of tomograms with dynamin T-shaped structures around vesicles and tubes. Middle and right panels show 3D segmentation of vesicles at 0°C and ~45°C tilts respectively. As you rotate the segmented volumes, striations of the dynamin density (yellow) are observed indicating a helical assembly of dynamin around the lipid bilayer (grey). f Schematic drawing: dynamin helix surrounds and constricts Λ’s base, converting Λ to Ω. This drawing is similar to Fig. 4g, except that the label “Base constriction” is changed to “Constriction by dynamin helix”, according to results shown in Fig. 5a–e. Source data are provided as a Source Data file.

