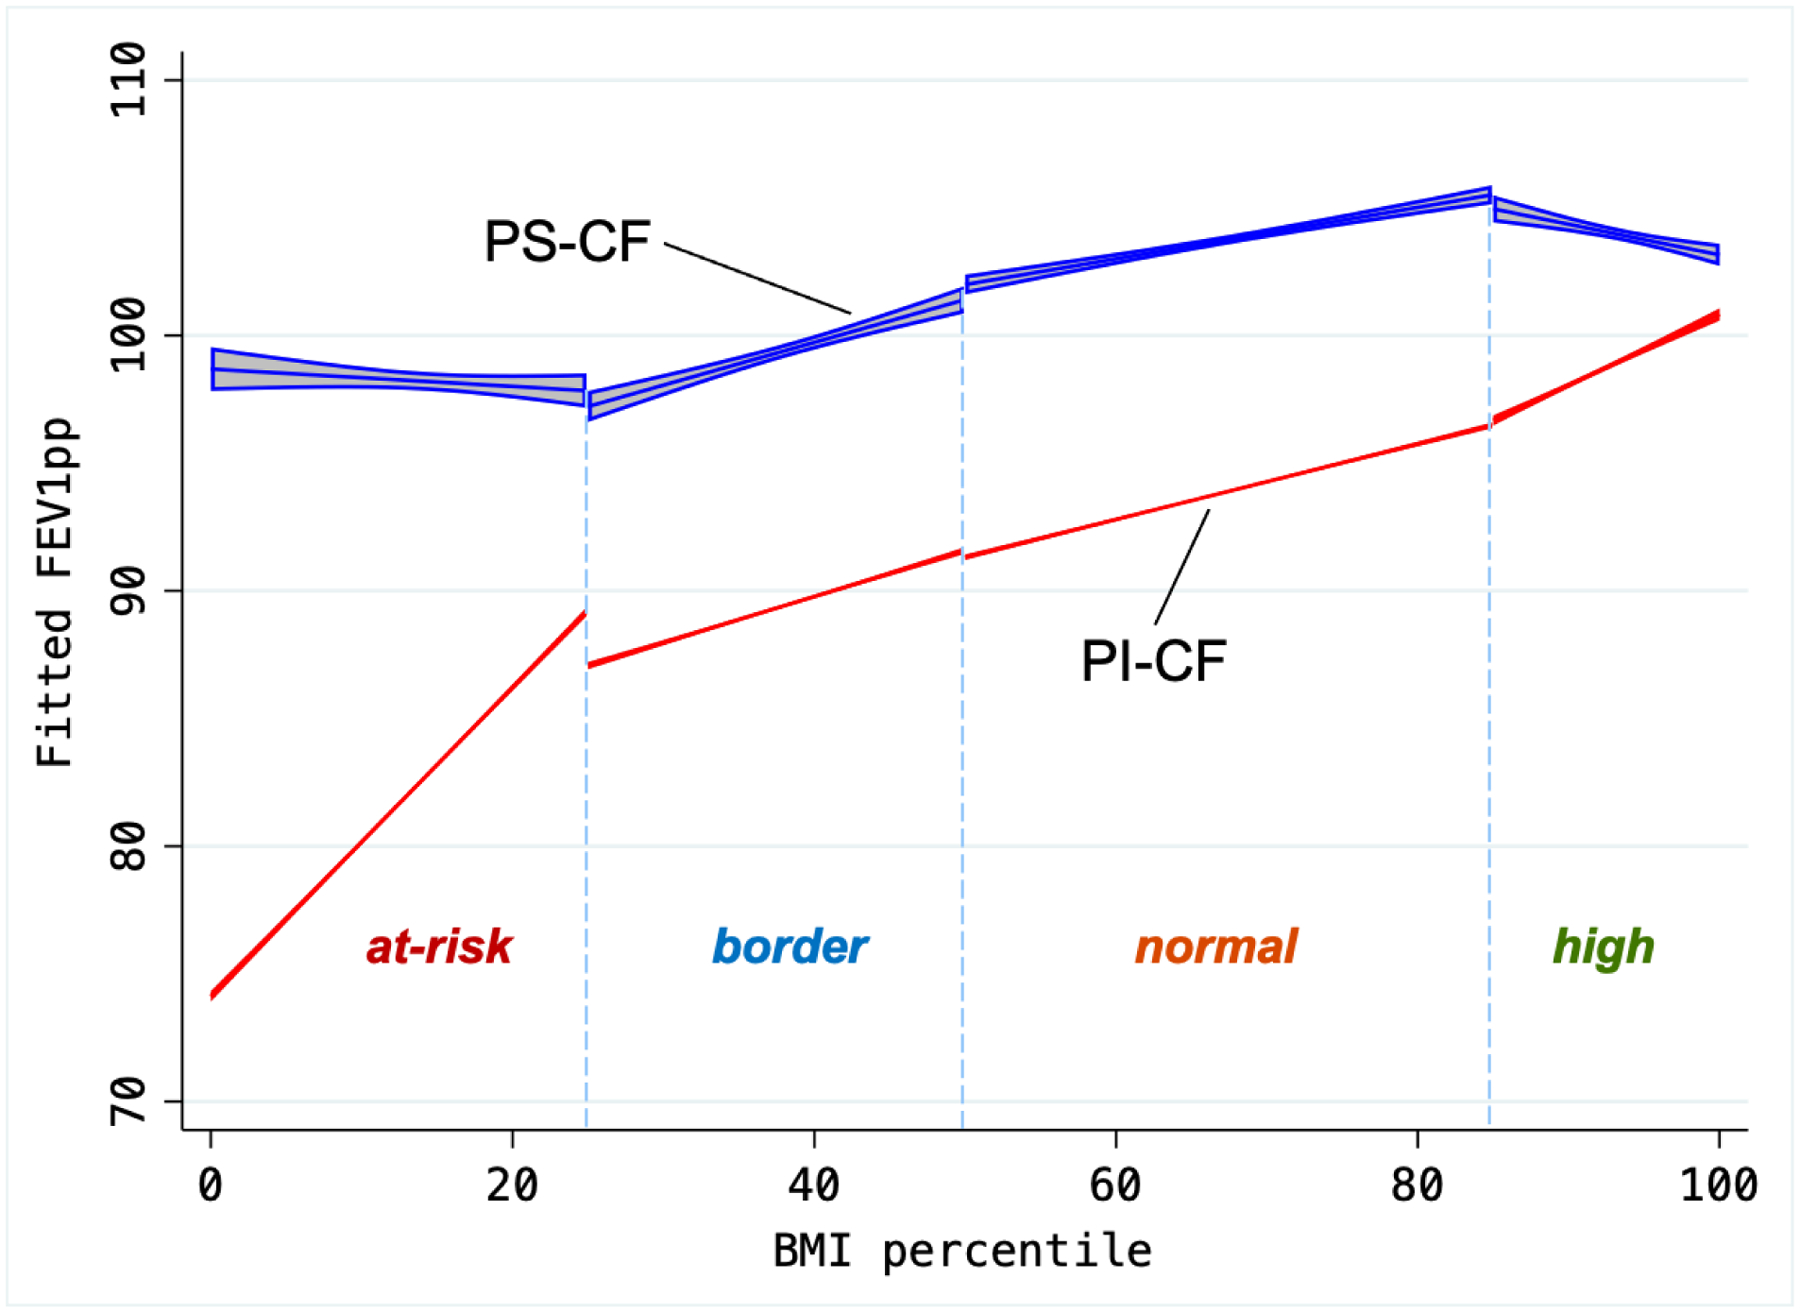
Figure 2 – Fitted values of FEV1 by BMI and pancreatic status.

Predicted FEV1pp, based on adjusted linear model including the main effects of BMI and pancreatic status, as well as their interaction term, within each separate BMI category. FEV1 increases at relatively similar rates in PS across categories as BMI increases through the 85th percentile, but then it decreases among overweight/obese PS subjects. In contrast, FEV1 increases at a markedly higher rate in PI subjects as BMI increases in the at-risk category (through the 25th percentile), then keeps a steady rate as BMI increases through the 99th percentile.
