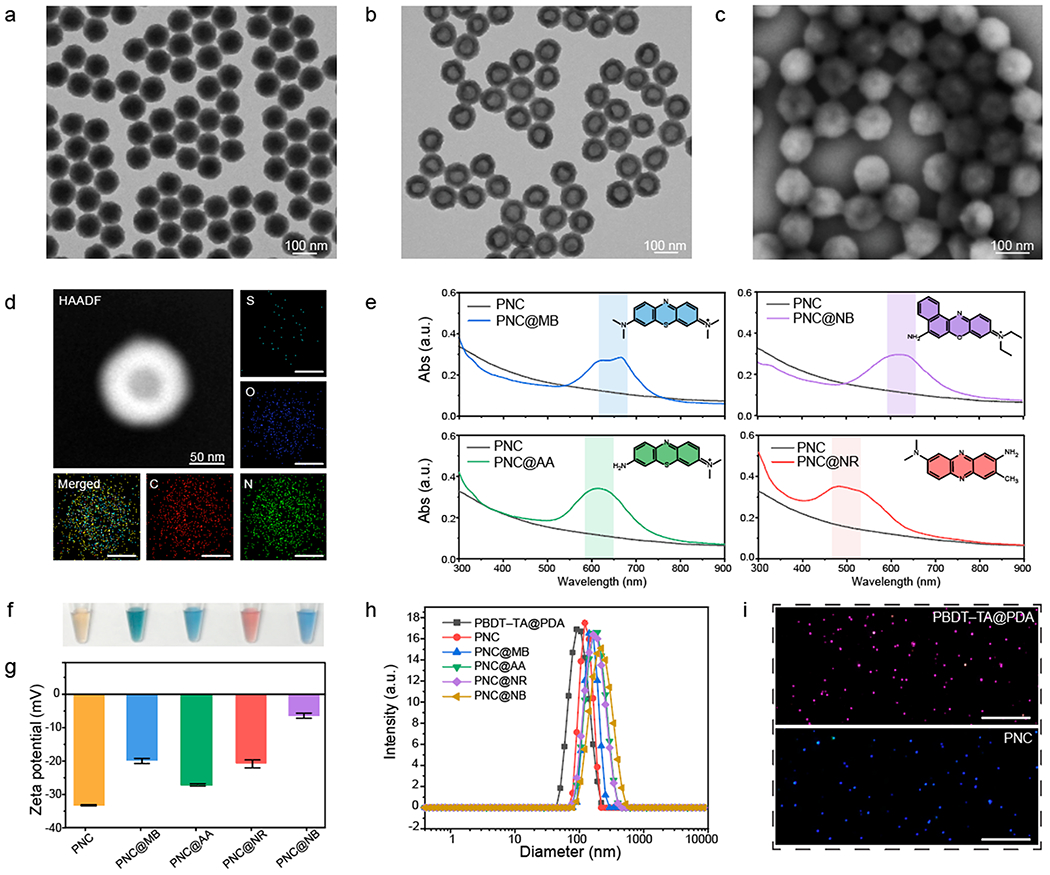
Figure 1.

Dye-loaded PNC. TEM image of (a) PBDT-TA@PDA and (b) PNC. (c) SEM image of PNC. (d) EDX and HAADF-STEM images of PNC. The scale bars represent 50 nm. (e) UV–vis–NIR absorption spectra of PNC@MB, PNC@AA, PNC@NR, and PNC@NB with respect to PNC alone. Black and colored curves represent PNC alone and dye-loaded PNCs. (f) Photograph of PNC (brown), PNC@MB (dark green), PNC@AA (blue), PNC@NR (red), and PNC@NB (blue) in aqueous solution. (g) Zeta potential of PNC, PNC@MB, PNC@ AA, PNC@NR, and PNC@NB. The error bars represent the standard deviation of three separate measurements. (h) DLS data of PBDTTA@ PDA, PNC, PNC@MB, PNC@AA, PNC@NR, and PNC@NB. (i) NTA images of PBDT-TA@PDA and PNC. Pink and blue dots represent monodispersed PBDT-TA@PDA and PNC. The scale bars represent 10 μm.
