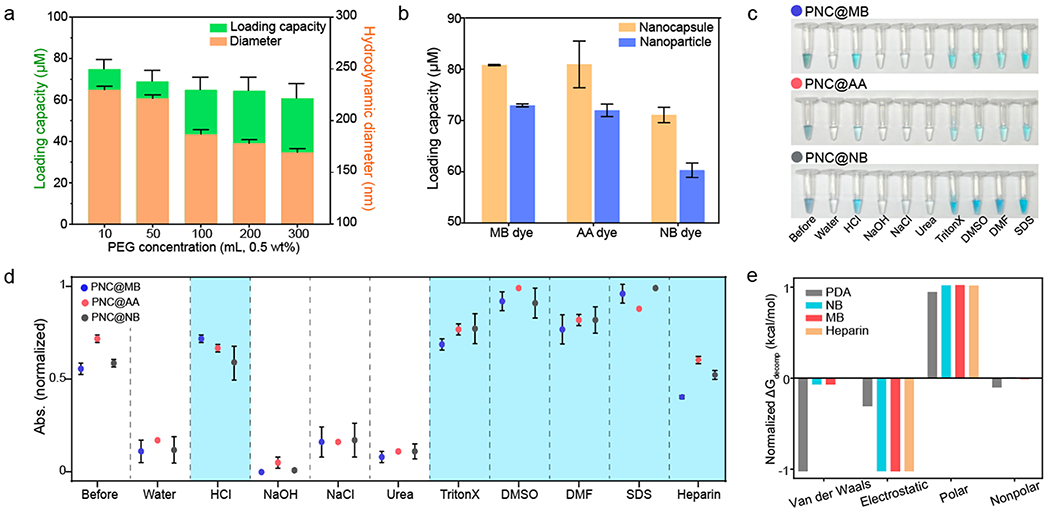
Figure 2.

Dye–PNC assemblies. (a) Loading capacity and hydrodynamic diameter of PNC@MB, where the surface of PNC was modified with different concentrations of HS-mPEG. (b) Loading capacity comparison between PDA nanocapsule and PDA nanoparticle. (c) Photograph of the released dyes in different media (from left to right: before centrifugation, water, HCl, NaOH, NaCl, urea, TritonX-100, DMSO, DMF, and SDS). (d) Quantification of data in panel c: Release of the loaded dye in PNC in different media. Blue area indicates where the loaded dyes were released. (e) Decomposition analysis of the normalized Gibbs free energy of PDA, NB, MB, and heparin using MD simulation. Van der Waals, electrostatic, and polar/nonpolar solvation were investigated for the analysis. The error bars represent the standard deviation of three separate measurements.
