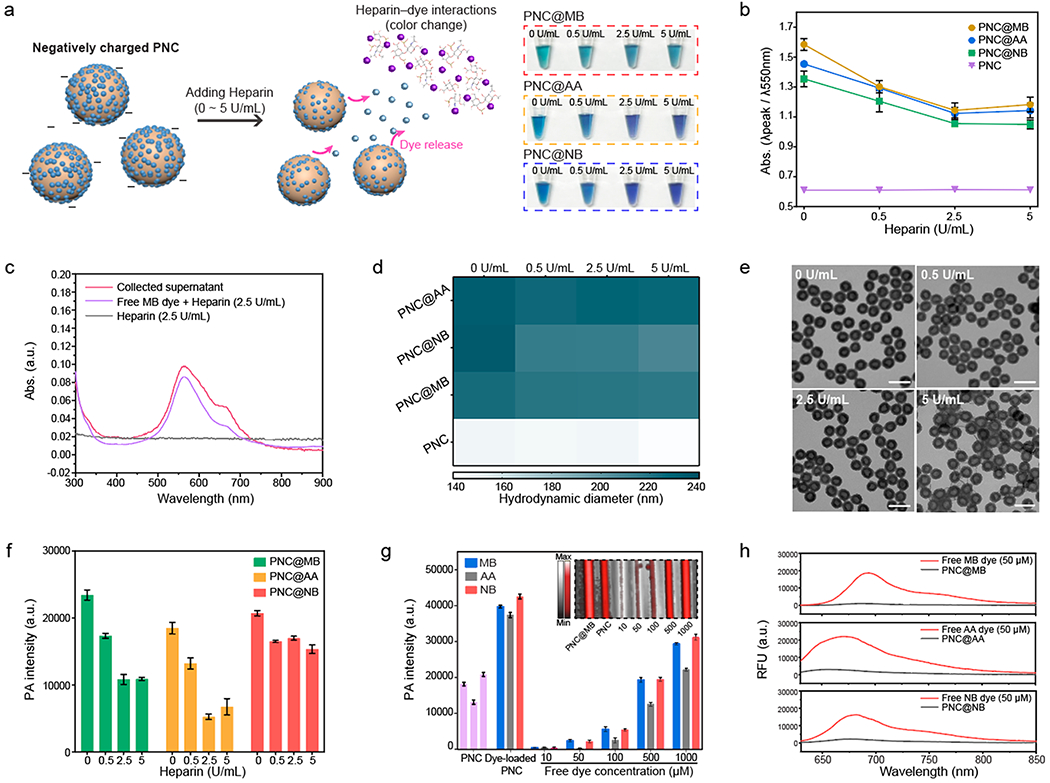
Figure 3.

Disassembly of the loaded dyes in negatively charged PNC. (a) Schematic of releasing loaded dyes in negatively charged PNC during heparin interaction. Photograph shows color change of PNC@MB, PNC@AA, and PNC@NB after heparin interaction. (b) Absorbance change of dye-loaded PNC after heparin interaction. The error bars represent the standard deviation of three separate measurements. (c) PNC@MBs were centrifuged down to collect the supernatant after heparin interaction. UV–vis–NIR spectra shows that the absorbance obtained from the collected supernatant was matched with free MB dye–heparin interaction. (d) Hydrodynamic diameter of PNC@MB, PNC@AA, PNC@NB, and PNC after heparin interaction. (e) TEM images of PNC@MB after heparin interaction. The scale bars represent 200 nm. (f) Decrease in PA signal after releasing the loaded dyes in PNC during heparin interaction. The error bars represent the standard deviation of five regions of interest. (g) PA signal comparison between free dyes and dye-loaded PNC that loaded 50 μM dye. Purple bars represent PA signal of PNC alone. The inset image represents the PA image of PNC@MB compared to free MB dye. The error bars represent the standard deviation of five regions of interest. (h) Fluorescence of free MB, AA, and NB dyes compared to MB@PNC, AA@PNC, and NB@PNC that loaded 50 μM dye. The experiments in (f) and (g) were repeated independently three times with similar results.
