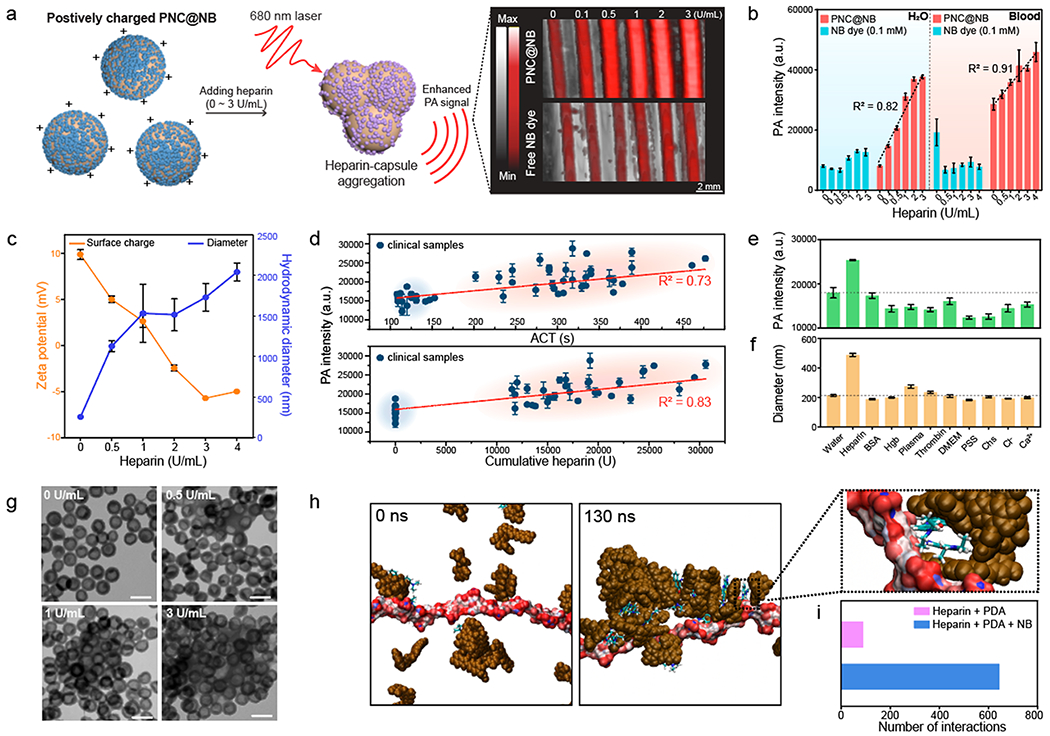
Figure 4.

Aggregation-induced PA enhancement of positively charged PNC. (a) Schematic of induced PNC@NB–heparin aggregation. Photograph indicates outstanding PA performance of PNC@NB over free NB dye (100 μM) for monitoring heparin. (b) PA signal comparison between PNC@NB and free NB dye at the same dye concentration in either water (R2 = 0.82) or whole human blood (R2 = 0.91). The error bars represent the standard deviation of five regions of interest. (c) DLS data and the surface charge of PNC@NB after heparin interaction in water. The error bars represent the standard deviation of three separate measurements. (d) PA signal of PNC@NB tested with clinical samples. The PA signal was linearly increased as a function of cumulative heparin (R2 = 0.83) and ACT values (R2 = 0.73). Clinical samples were collected from 17 patients undergoing cardiac procedures. Blue and red regions indicate before (blue) and after (red) heparin infusion. The error bars represent the standard deviation of five regions of interest. (e) PA intensity and (f) corresponding size when PNC@NB interacted with other complex sample matrices. The error bars represent the standard deviation of three separate measurements. (g) TEM images of aggregated PNC@NB during heparin interaction. The scale bars represent 200 nm. (h) Evolution profiles of the size of the complex, comprised of PDA (brown), heparin (red/white), and free NB dye, showing the aggregation in explicit water. Magnified interface section shows that NB dye bridged interaction between PDA and heparin. (i) Number of interactions between heparin and PDA for both PDA+heparin+NB and PDA+heparin systems. The experiments in (b), (d), and (e) were repeated independently three times with similar results.
