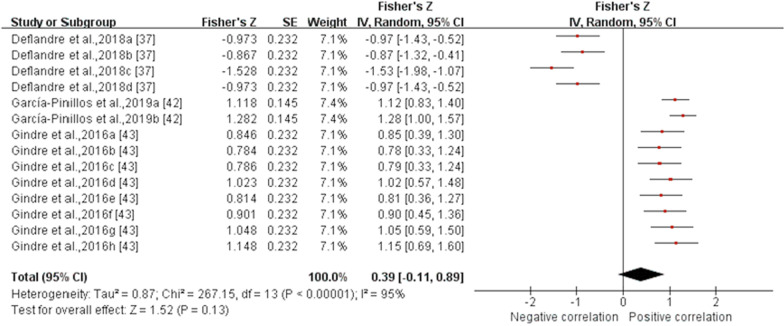
Fig. 4.
Forest plot describing the validity of flight time measured using IMU (Intraclass correlation coefficient, ICC). Squares represent Fisher’s Z; bars indicate 95% confidence intervals and diamonds as pooled data. Deflandre et al.,2018a (8 km/h, IMUs vs optical motion capture system), 2018b (16 km/h, IMUs vs optical motion capture system), 2018c (8 km/h, IMUs vs Optogait), 2018d (16 km/h, IMUs vs Optogait) [37]; García-Pinillos et al.,2019a (IMUs vs optical motion capture system, IMUs: Stryd™), 2019b (IMUs vs optical motion capture system, IMUs: RunScribe™) [42]; Gindre et al.,2016a (12 km/h, IMUs vs optical motion capture system), 2016b (15 km/h, IMUs vs optical motion capture system), 2016c (18 km/h, IMUs vs optical motion capture system), 2016d (21 km/h, IMUs vs optical motion capture system), 2016e (12 km/h, IMUs vs Optojump), 2016f (15 km/h, IMUs vs Optojump), 2016 g (18 km/h, IMUs vs Optojump), 2016 h (21 km/h, IMUs vs Optojump) [43]. SE standard erroSr, IV inverse variance, CI confidence interval.

