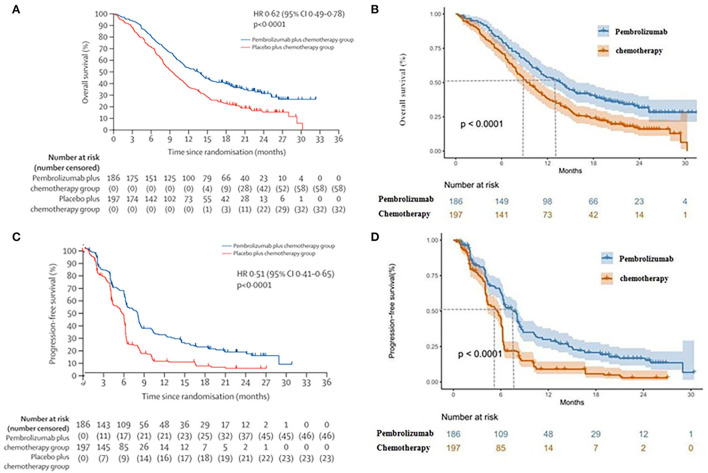
Figure 2.
(A) Kaplan–Meier curve of the overall survival from the KEYNOTE-590 trial. (B) Simulate overall survival curve for pembrolizumab group and chemotherapy group. (C) Kaplan–Meier curve of progression-free survival from the KEYNOTE-590 trial. (D) Simulate progression-free survival curve for pembrolizumab group and chemotherapy group.

