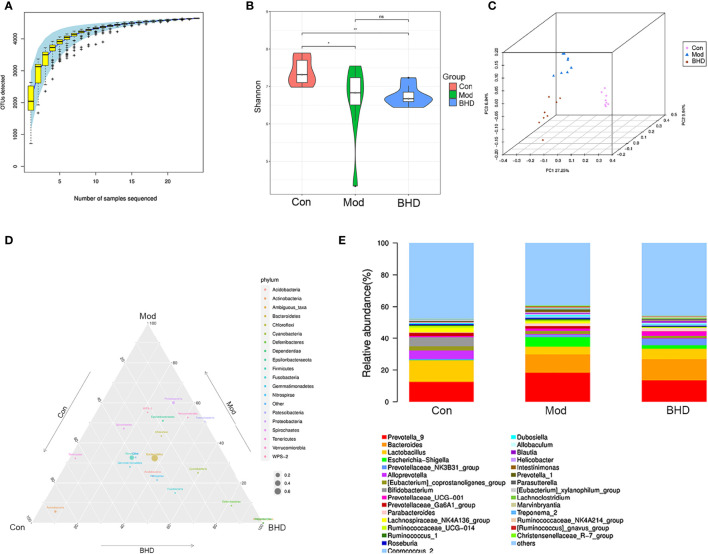
Figure 3.
BHD modulated the overall structure and composition of the gut microbiota in rats with CI. (A) Species accumulation curve. (B) Shannon diversity index. (C) PCoA based on unweighted UniFrac distances. (D) Ternary phase diagram. (E) Community structure bar plot at the genus level. **p < 0.01, *p < 0.05. ns, not statistically significant. Con, control group; Mod, model group; BHD, BHD group. n = 8 per group.

