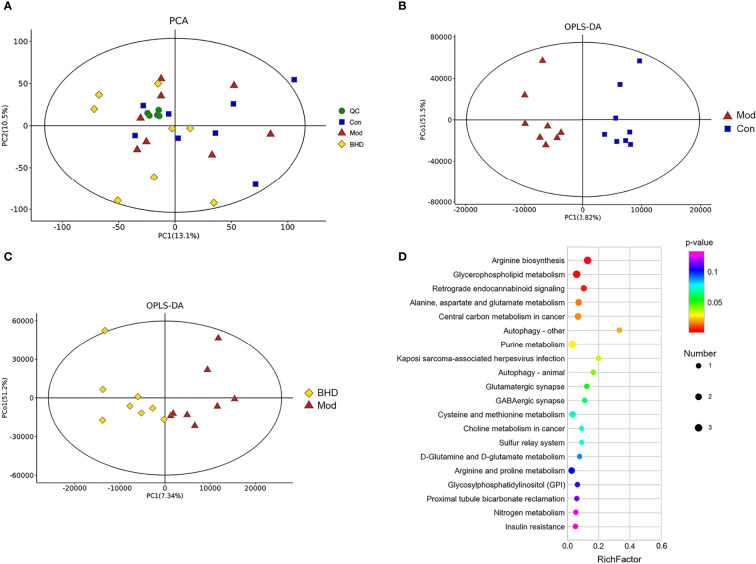
Figure 6.
BHD regulated hippocampal metabolism in rats with CI. (A) Hippocampal metabolite analysis of the three groups based on PCA. QC, quality control. (B) Score plots of OPLS-DA between the control and model groups. (C) Score plots of OPLS-DA between the BHD and model groups. (D) Bubble diagram of the metabolic enrichment pathways based on the differentially abundant metabolites among the three groups. The x-axis shows the Rich factor, the color of the circle indicates the p value, and the size of the circle reflects the number of differentially abundant metabolites in each pathway. n = 8 per group.

