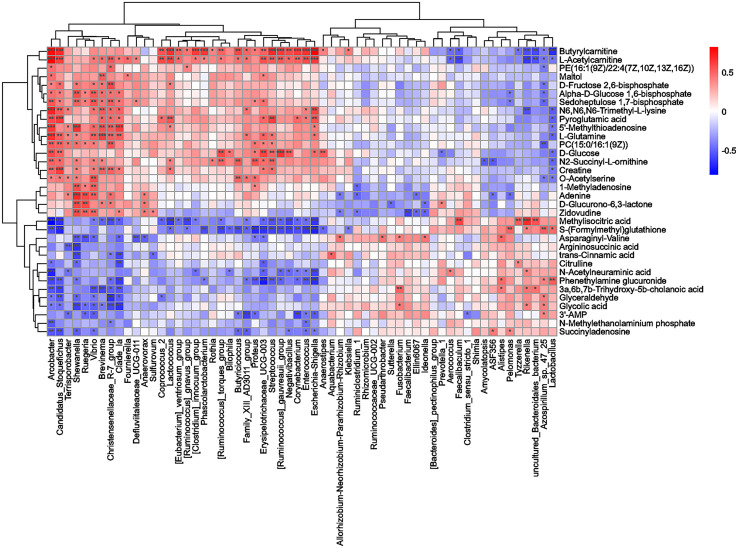
Figure 7.
Correlation analysis of differentially abundant microbial taxa and differentially abundant hippocampal metabolites. Spearman correlation coefficients were used to generate the matrix. The degree of correlation is shown by the gradient change in colors; red denotes a positive correlation, and blue denotes a negative correlation. ***p < 0.001, **p < 0.01, *p < 0.05.

