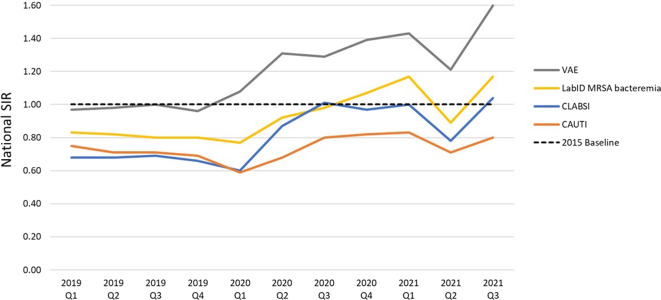
Fig. 1.
Quarterly national SIRs for select HAI types, 2019-Q1 through 2021-Q3. The HAIs shown on this graph have been most affected by the COVID-19 pandemic, as demonstrated by CDC data. 1,2 SIRs for other types of infections are available in Tables 1–3 and in prior reports. 1,2 This graph displays the quarterly SIR point estimates from 2019-Q1 through 2021-Q3 and does not constitute a statistical trend analysis.
Note: SIR, standardized infection ratio; HAI, healthcare-associated infection; VAE, ventilator-associated event; LabID, laboratory–identified; MRSA, methicillin-resistant Staphylococcus aureus; CLABSI, central-line–associated bloodstream infection; CAUTI, catheter-associated urinary tract infection.

