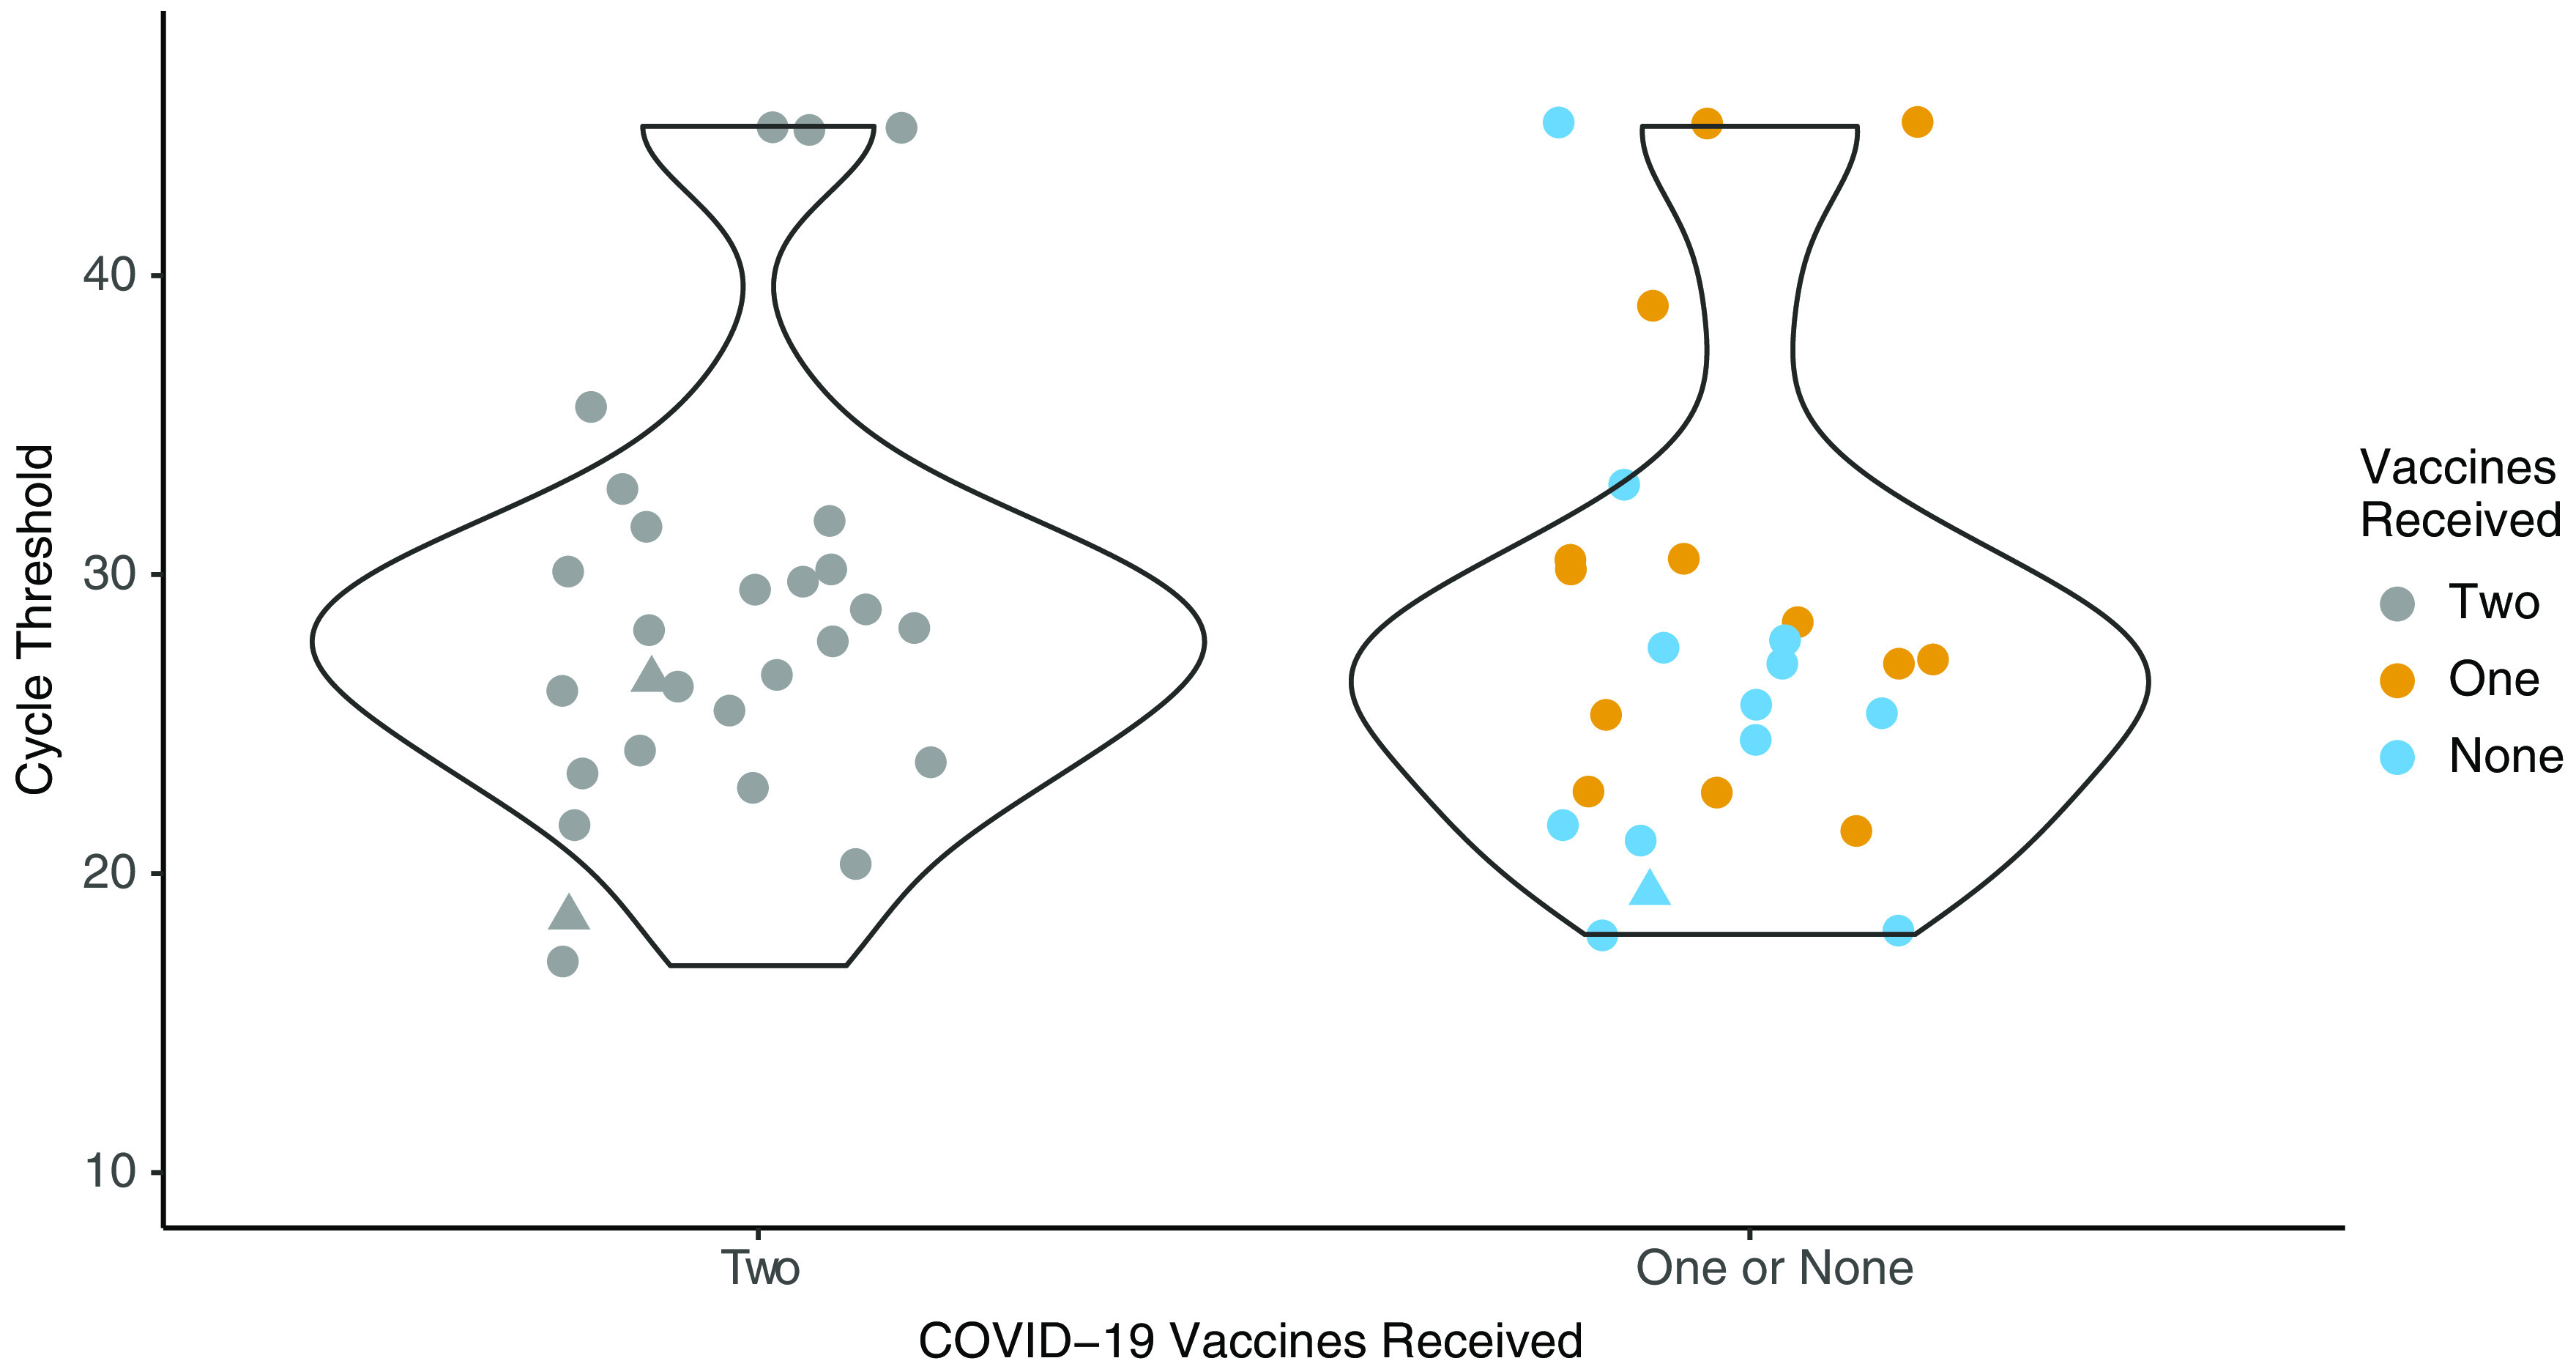
Fig. 1.

Cycle threshold values from a self-collected oral–nasal swab at day 7 following symptom onset for the SARS-CoV-2 E-gene separated by vaccine doses. The triangles denote the specimens where SARS-CoV-2 could be cultured of the 25 with the lowest cycle thresholds that were evaluated.
