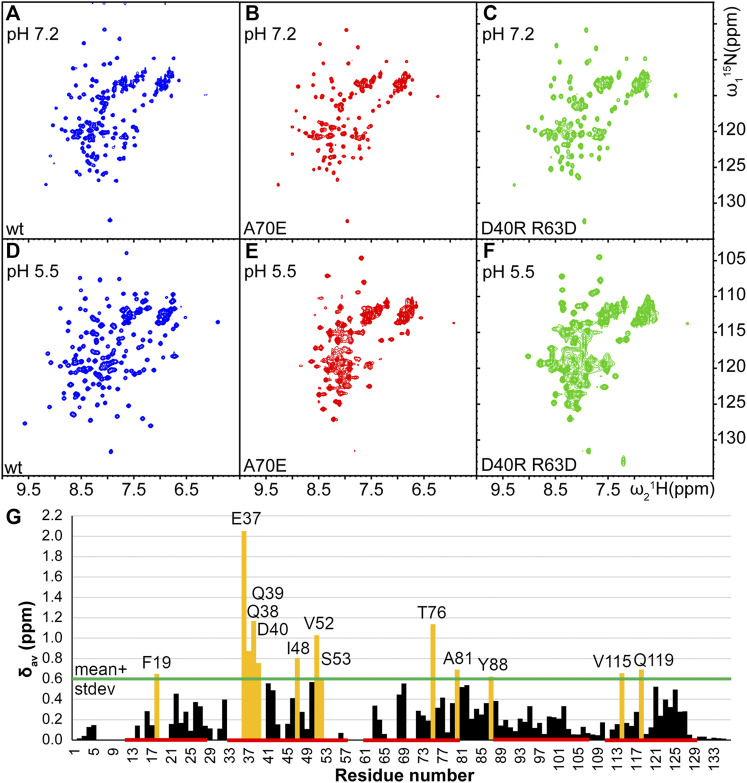
FIGURE 2.
Comparison of 15N-1H HSQC spectra of TuSp NT (blue,A and D) and its potential monomeric mutants TuSp NTA70E (red,B and E), and TuSp NTD40RR63D (green,C and F) in 300 mM NaCl, 20 mM NaPi, pH 7.2 and 20 mM NaCl, 20 mM NaOAc, pH 5.5 respectively. (G) Averaged backbone amide 15N and 1H chemical shift differences between TuSp NTA70E at pH 7.2 and wt TuSp NT dimer at pH 5.5. Residues showing chemical shift differences larger than mean plus one standard deviation are highlighted in yellow and identified. Locations of helices are indicated with a red line.

