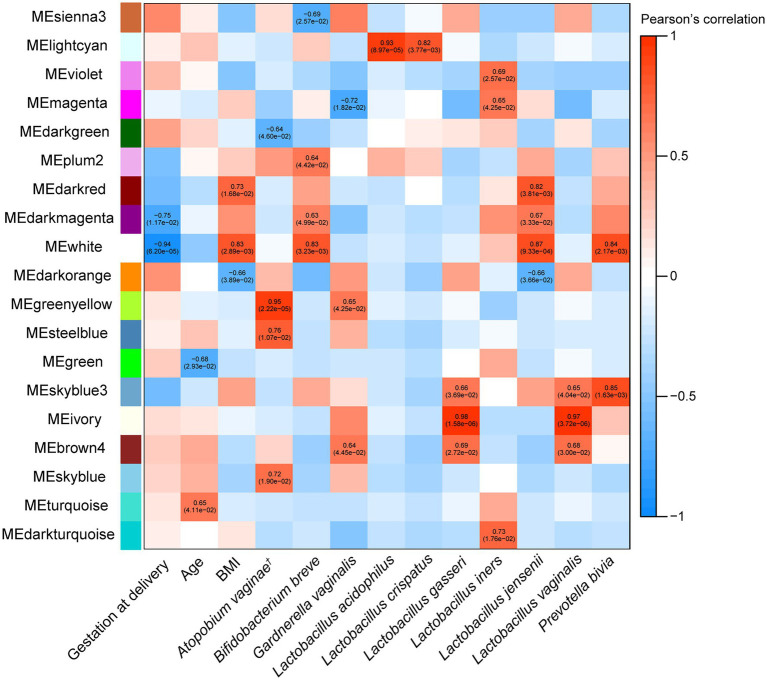
Figure 3.
Weighted gene correlation network analysis (WGCNA) heatmap of correlations between module eigengenes (MEs), which represent each cluster of expressed cervical neutrophil genes, and microbiota taxa relative abundance and other maternal quantitative clinical data in all women (N = 10). Significant Pearson correlations (p < 0.05) between MEs and traits have text with the correlation value, followed by the p-value in brackets. Modules with no correlations between their MEs and microbiome or clinical data are not shown. The list of gene in each module is in Supplementary Table 3. † Atopobium vaginae is also known as Fannyhessea vaginae as per new nomenclature.

