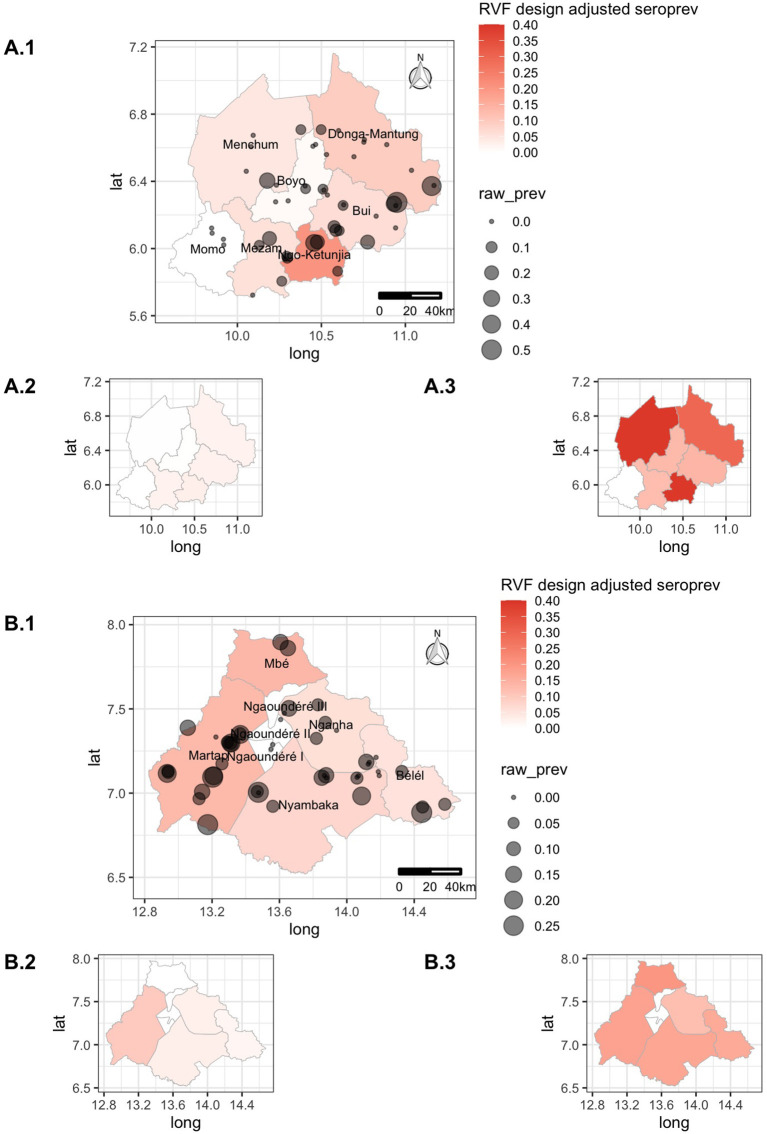
Figure 3.
Choropleth maps of the Northwest Region (NWR) (A) and Vina Division (VIN) (B) in Cameroon colored by design-adjusted apparent seroprevalence for the administrative strata, overlaid with the approximate location of individual herds sized by the raw proportion of animals positive within each herd. The smaller inset choropleth maps are for the lower (X.2) and upper (X.3) 95% confidence intervals, respectively, for each site.

