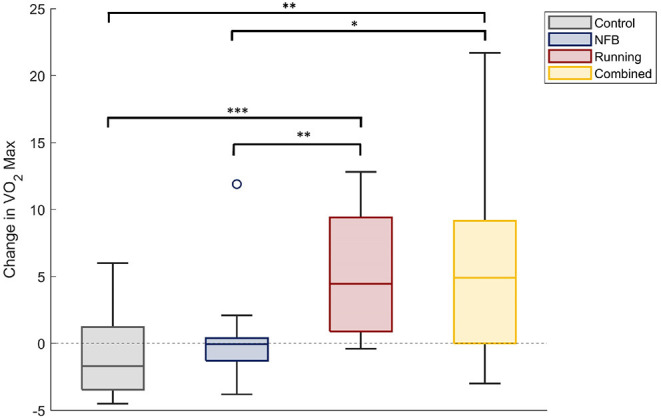
Figure 2.

The change in VO2-max scores of participants within each experimental group. The Running and Combined groups show a significant increase in VO2Max compared to the Control and NFB groups. Significance of post-hoc pairwise independent samples t-tests are represented by *p < 0.05, **p < 0.01, and ***p < 0.001.
