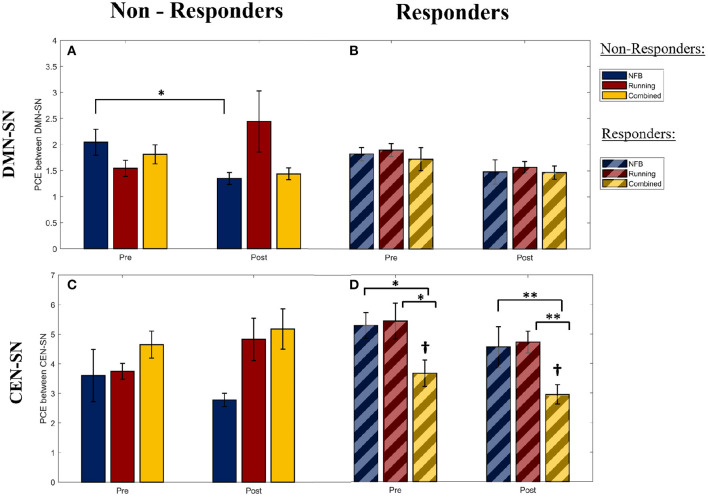
Figure 4.
The pairwise cross-entropy (PCE) between the DMN/CEN and SN networks during WM trials (a lower PCE value indicates higher DMN/CEN-SN synchrony). PCE is calculated for the DMN-SN pair within the Non-Responders (A) and Responders (B), for the CEN-SN pair within the Non-Responders (C), and Responders (D). Significance of post-hoc pairwise independent samples t-tests are represented by *p < 0.05 and **p < 0.01. †Represents a significant difference (p < 0.05) with respect to Non-Responders within the Combined group at the corresponding timepoints. Error bars shown are ± 1 SE.

