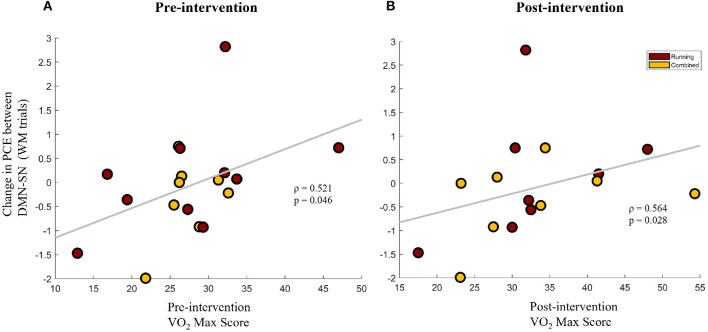
Figure 5.
The change in pairwise cross-entropy (PCE) between the DMN and SN networks during WM trials (a lower PCE value indicates higher DMN-SN synchronization) for the participants that participated in the aerobic exercise protocol (Running group + Combined group). Change in PCE is shown against the VO2-Max scores of the participants at the pre-intervention timepoint (A) and the post-intervention timepoint (B).

