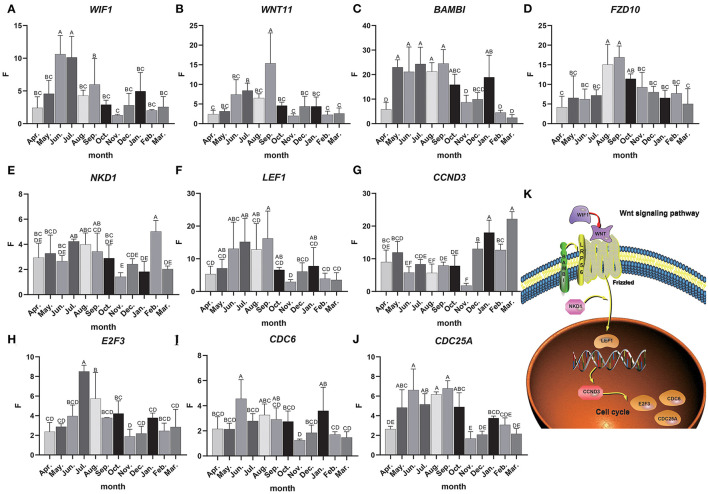
Figure 5.
Candidate gene expression analysis. (A–J) The relative expression of candidate genes, the Abscissa indicates the month, the ordinate is the relative expression F, different letters are marked to indicate significant, while the same letters indicate that the differences are not significant, the error bar represents SD. (K) Interactive network control chart.

