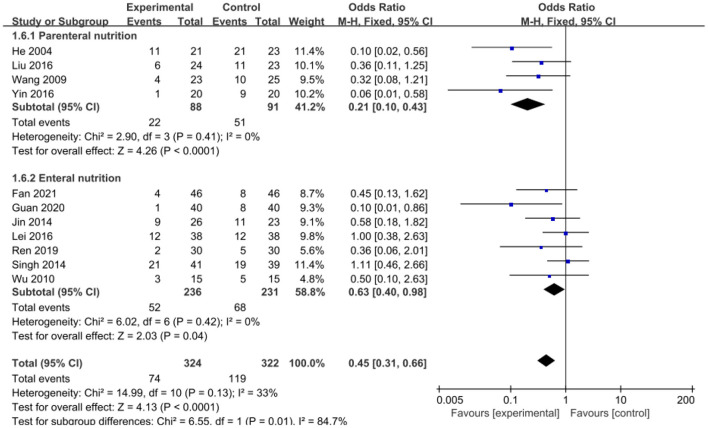
Figure 9.
Forest plots of complications associated with experimental group (parenteral or enteral nutrition group supplemented with Gln) vs. control group (conventional nutrition group). I2 tests and P are the criteria for the heterogeneity test, ♦, pooled odds ratio; —■—, odds ratio, and the edges of ♦, 95% CI.

