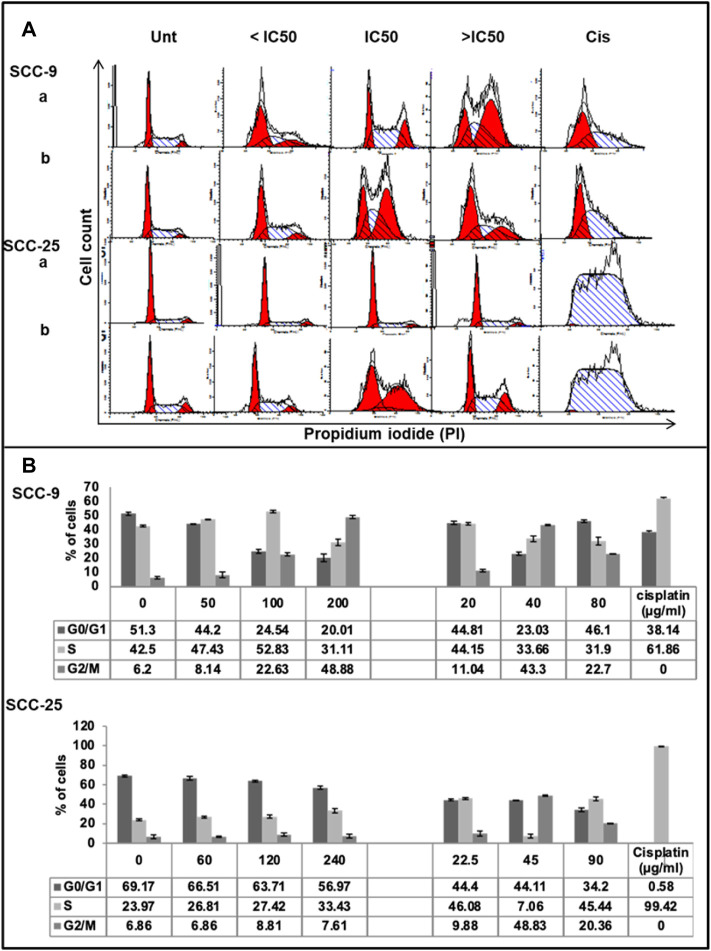
FIGURE 4.
Effect of CZE and CIN on cell cycle of oral cancer cells. Flow cytometric analysis of DNA content in different phases of the cell cycle after 48 h exposure to the indicated concentrations of (a). CZE and (b). CIN on both SCC-9 and SCC-25 cells (A) Representative histogram cell cycle analysis of untreated, CZE (50, 100, and 200 μg/ml) and CIN treatments (20, 40, and 80 μm) and cisplatin (2 μg/ml) treated cancer cells (B) Bar graphs showing the percentage (each value represents as mean ± SD) of cells in each phase indicating a significant arrest in specific phase of cell cycle.

