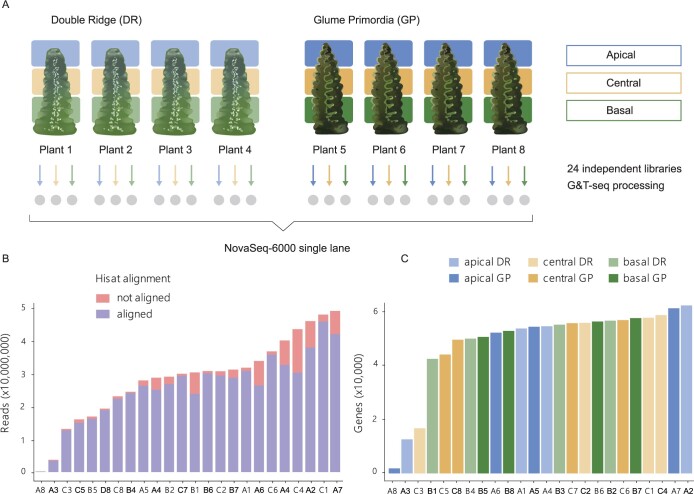
Figure 1.
Low-input G&T sequencing of developing wheat spikes. A, Summary diagram of tissue collection and sequencing. Gray circles indicate the 24 individual libraries prepared for sequencing from each individual tissue section dissected from individual spikes. B, Reads per library after trimming and quality controls (see “Materials and methods”). Stacked bars indicate the number of reads aligned (blue) and not aligned (red) by HISAT to the RefSeq version 1.0 genome. C, Number of expressed genes (>10 read counts) per library based on tissue section and Waddington developmental stage. In (B and C), the X-axis indicates the ID of each sample which is composed of the tissue section (A: apical, C: central, B: basal) and plant number (1–8) as indicated in (A). Detailed quality control data for each library is provided in Supplemental Table S1.

