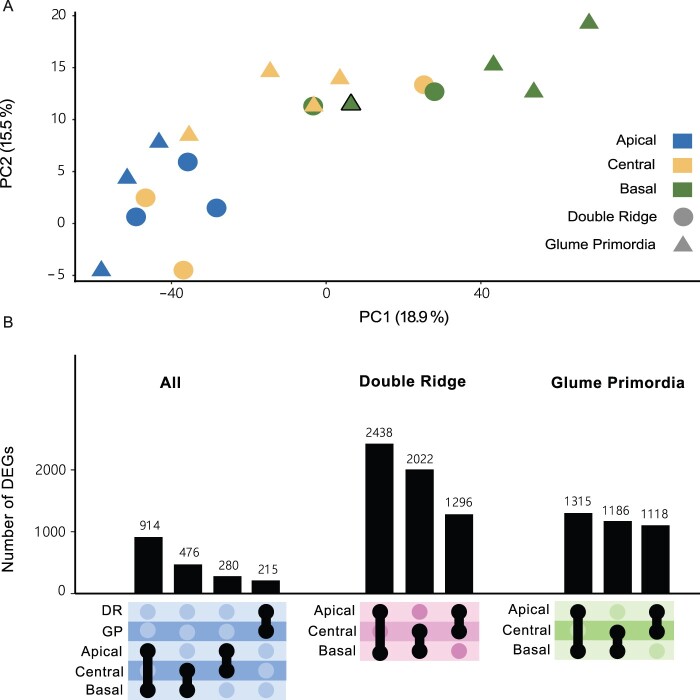
Figure 2.
Transcriptome-wide differences are larger between tissue sections than developmental time points. A, PCA on the 19 transcriptome libraries from apical (blue), central (yellow), and basal (green) sections of DR (circles) and GP (triangles) spikes. Black bordered triangle is plant 8 (GP) in which the basal section clustered closer with central-GP sections than the other basal-GP sections. B, UpSet plot showing the number of DEGs between spatial sections and Waddington stages.

