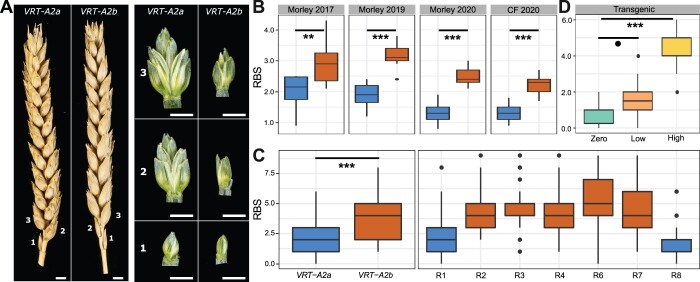
Figure 5.
Phenotypic difference between VRT-A2a (blue) and VRT-A2b (orange) on RBS numbers. A, Mature spikes from the field (left) and dissected basal spikelets at anthesis (right) from the glasshouse. Numbers indicate position along the spike starting at the base. Scale bar = 0.5 cm. B, Number of RBS per spike from 10-ear samples collected in the field at maturity at Morley (2017, 2019, and 2020) and Church Farm (CF, 2020). Year 2017/2019 = 10–15 independent replicates per genotype; 2020 = 20 independent replicates per genotype and location. C, Number of RBS recorded in the glasshouse for the NILs (left) and for seven critical recombinant lines (R1–R4, R6–R8; see Supplemental Table S8 for graphical genotype of these lines from Adamski et al. (2021), n = 18–20 plants). D, RBS per spike recorded for the transgenic lines carrying zero (n = 10 plants), low (1–5, n = 20 plants), or high (9–35, n = 10 plants) copy-number insertions of VRT-A2b in cv. Fielder. In (B–D), the box represents the middle 50% of data with the borders of the box representing the 25th and 75th percentile. The horizontal line in the middle of the box represents the median. Whiskers represent the minimum and maximum values, unless a point exceeds 1.5 times the interquartile range in which case the whisker represents this value, and values beyond this are plotted as single points (outliers). Statistical classifications in (B) and (C) are based on two-way ANOVA tests and in (D) on Dunnett’s test against the zero-copy number lines. P-values: o0.1 ; **0.01; ***0.001.

