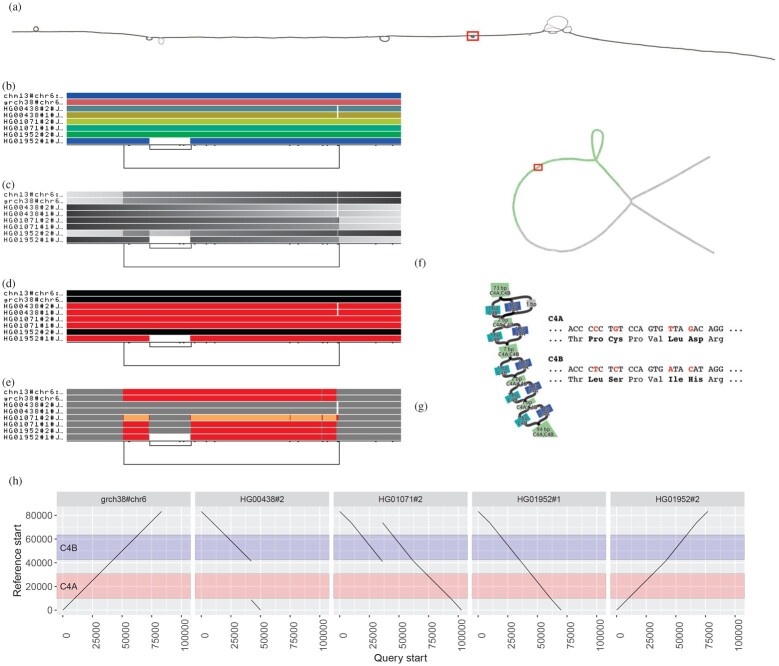
Fig. 2.
Visualizing the major histocompatibility complex (MHC) and complement component 4 (C4) pangenome graphs. (a) odgi draw layout of the MHC pangenome graph extracted from a whole human pangenome graph of 90 haplotypes. The red rectangle highlights the C4 region. (b–e) odgi viz visualizations of the C4 pangenome graph, where eight paths are displayed: two reference genomes (CHM13 and GRCh38 on the top) and six haplotypes of three diploid individuals. (b) odgi viz default modality: the image shows a quite linear graph. The links at the bottom indicate the presence of a structural variant (long link) with another structural variant nested inside it (short link on the left). (c) Color by path position. The top two reference genomes and one haplotypes (HG01952#2) go from left to right, while five haplotypes go in the opposite direction, as indicated by the black color on their left. (d) odgi viz color by strandness: the red paths indicate the haplotypes that were assembled in reverse with respect to the two reference genomes. (e) odgi viz color by node depth: using the Spectra color palette with four levels of node depths, white indicates no depth, while gray, red and yellow indicate depth 1, 2 and greater than or equal to 3, respectively. Coloring by node depth, we can see that the two references present two different allele copies of the C4 genes, both of them including the HERV sequence. The entirely gray paths have one copy of these genes. HG01071#2 presents three copies of the locus (orange), of which one contains the HERV sequence (gray in the middle of the orange). In HG01952#1, the HERV sequence is absent. (f) Layout of the C4 pangenome graph made with the Bandage tool (Wick et al., 2015) and annotated by using odgi position. Green nodes indicate the C4 genes (in red). The red rectangle highlights the regions where C4A and C4B genes differ. (g) Annotated Bandage layout of the C4 region where C4A and C4B genes differ due to single nucleotide variants leading to changes in the encoded protein sequences. Node labels were annoted by using odgi position. (h) Visualization of odgi untangle output in the C4 pangenome graph: the plots show the copy number status of the sequences in the C4 region with respect to the GRCh38 reference sequence, making clear, for example, that in HG00438#2, the C4A gene is missing (no black lines in the region annotated in red) (A color version of this figure appears in the online version of this article.)

