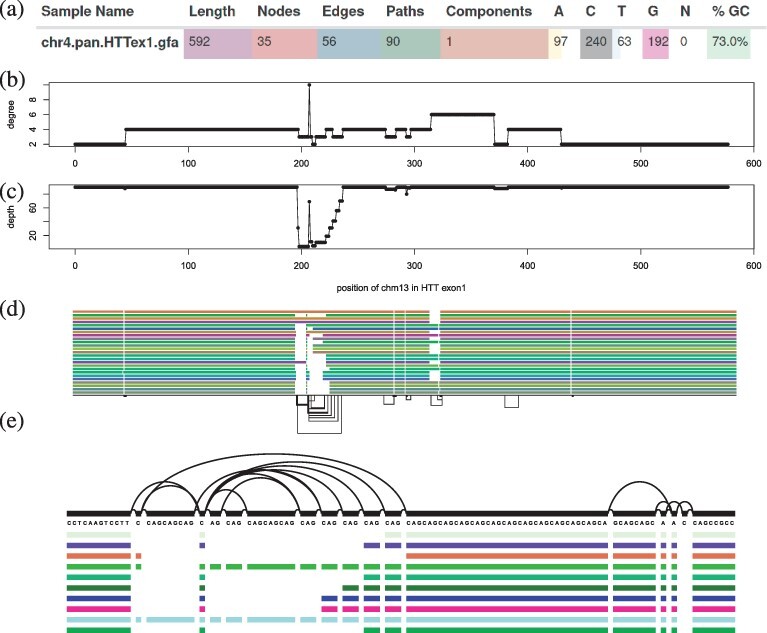
Fig. 3.

Features of a 90-haplotype human pangenome graph of the exon 1 huntingtin gene (HTTexon1): (a) excerpt of vital statistics of the HTTexon1 graph displayed by MultiQC’s ODGI module. (b) Per nucleotide node degree distribution of CHM13 in the HTTexon1 graph. Around position 200 there is a huge variation in node degree. (c) Per nucleotide node depth distribution of CHM13 in the HTTexon1 graph. The alternating depth around position 200 indicates polymorphic variation complementing the above node degree analysis. (d) odgi viz visualization of the 23 largest gene alleles, CHM13 and GRCh38 of the HTTexon1 graph. (e) vg viz nucleotide-level visualization of 10 gene alleles, CHM13, GRCH38 of the HTTexon1 graph focusing on the CAG variable repeat region
