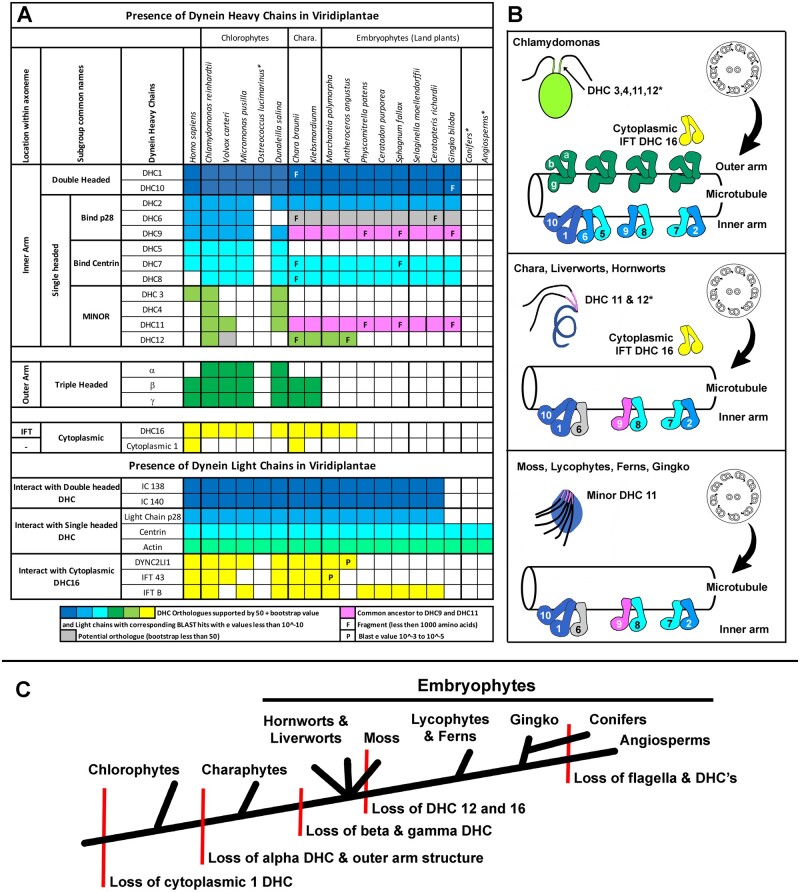
Figure 1.
DHCs in select land plants and Chlorophycean and Charaphycean Algae. A, Presence of DHCs in key Viridiplantae species and Homo sapiens, for comparison. Table of DHCs represents data from maximum parsimony analysis (Figure 2 and Supplemental Figure S2). Fragments (F) may be an artifact of sequencing. Light chain presence was determined through BLAST searches and colored boxes signify e values less than 10^−10, and “P” represents larger e values. Asterisks indicate organisms that do not produce flagella or cilia. B, Comparison of DHCs within axonemes of key plant and algal groups. In each panel, swimming cells and sperm (upper left) and axonemes are diagrammed in cross section (upper right) and longitudinal section (bottom). Four monomeric DHCs are considered “minor” and localize close to cell body (colored regions of flagella indicated with small arrow), while the localization of DHC12 is undetermined (*) (Yagi et al., 2009). C, Viridiplantae phylogeny showing loss of DHCs and axonemal structures.

