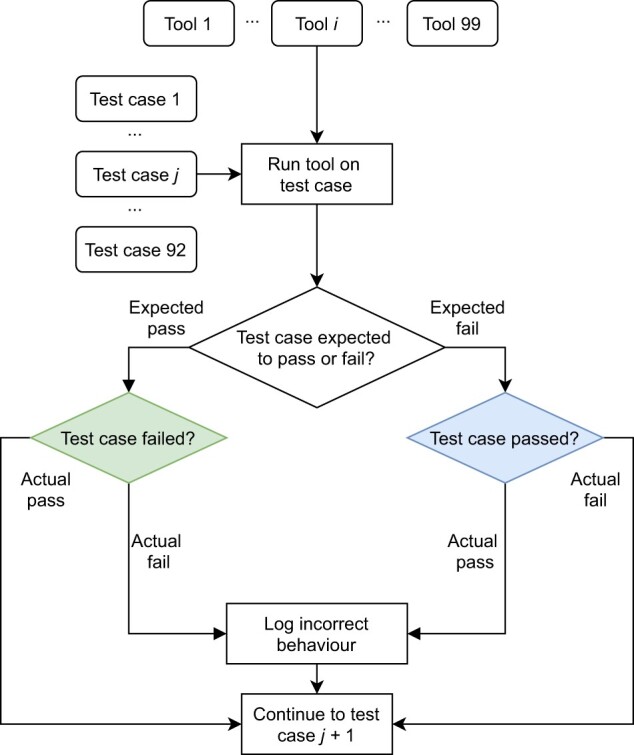
Fig. 1.

Flowchart depicting how Acidbio evaluates tools on the test suite. Rounded rectangles: inputs; sharp rectangles: procedures; rhombuses: conditional branches. All 99 tools run on all 92 test cases. After the 92nd test case, Acidbio moves onto the next tool and runs it on the first test case
