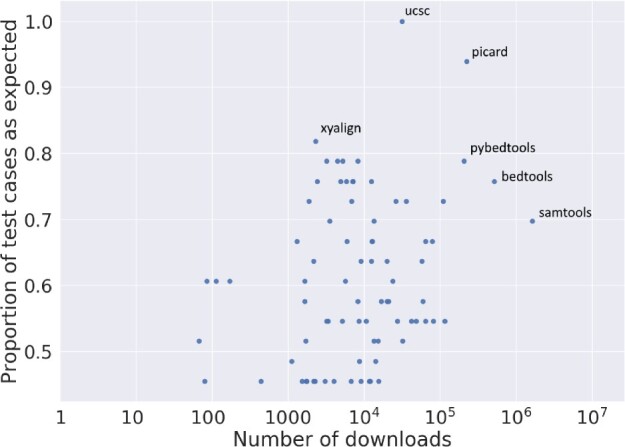
Fig. 6.

Scatter plot of the number of downloads a package has on Bioconda against its performance on BED3 tests. Labeled points indicate the top four performing tools and the top four most downloaded tools. For packages with multiple tools, we display results from the best-performing tool
