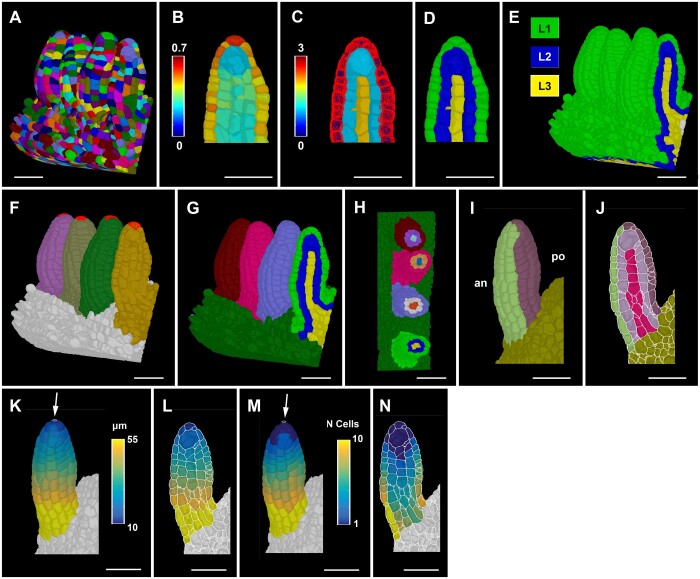
Figure 3.
Ovule primordium tissue detection and coordinate system. A, 3D segmented cell mesh view of a pistil fragment with four ovules of late Stage 2-I. B–D, Layer detection using the outside wall area ratio. B, Zoomed view of a sagittal section displaying the heatmap of outside wall area ratio. Threshold selection of outer surface cells based on the heatmap of outside wall area ratio. C, Heatmap indicates cell index, the number of cells an individual cell is separated from the selected outer surface cells marked in red. D, Heatmaps of cell distances in (C) were converted to integer values representing the tissue identity labels L1, L2, and L3. E, Same method applied to the entire 3D mesh shown in (A). F, 3D Mesh view of the specimens shown in (A) with the distal most cell selected for organ separation. G, Colors on individual ovule primordia represent the results of organ separation after selecting the distal most cell and clustering the cell connectivity network. Result of the combination of L1, L2, and L3 label and organ separated labels annotated for the ovules shown in (A). H, Transverse section of (G) displaying the L1, L2, and L3 labels for different ovules in different colors. I–J, Anterior (an) and posterior (po) labels added to the tissue-annotated ovule primordia 3D cell meshes. I, Surface view. J, Mid-sagittal section. K–L, Heatmap of distance coordinates from the point-like origin at the distal end of the organ (white arrow). Heat values indicate the distance in micrometer from individual cells centroid to the Bezier ring (indicated by white arrow) of the coordinates in a tissue restricted manner. K, 3D view. L, Sagittal section view. M and N, Heatmap of cell number coordinates instead of distance coordinates as in (K and L). Heat values indicate how many cells apart is a cell of interest from the origin of the coordinates through tissue-restricted manner. M, 3D view. N, Sagittal section view. Scale bars: 20 µm.

