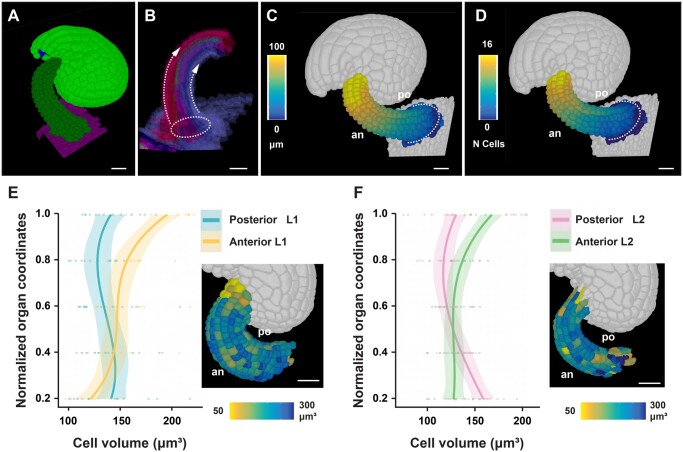
Figure 6.
Cellular features of funiculus curvature. Wild-type (Col-0) ovules of Stage 3-IV are analyzed. A, Tilted side-view of a 3D cell mesh. B, Semi-transparent 3D mesh view of funiculus extracted from the 3D mesh of the organ. The Bezier ring serving as origin is placed at the proximal base of the funiculus. The dashed arrow lines indicate the coordinate direction along the anterior and posterior midlines. C and D, Same specimen as in (A). The anterior (an) and posterior (po) sides are marked. C, Heatmap of cell distances along the proximal–distal axis of the funiculus. D, Heatmap of cell numbers along the proximal–distal axis of the funiculus. White dotted line indicates the coordinate origin as a ring. E, Graph depicting cell volumes of anterior and posterior L1 cells in relation to the normalized proximal–distal position. The inset in the bottom right corner shows a heat map of cell volume in the L1 of the funiculus. Fourteen 3D digital ovules were analyzed. Regression curves are cubic polynomials with 95% confidence intervals (shaded regions). Number of cells: 1,568 ≤ n ≤ 1,768. F, Similar graph as in (E) revealing cell volumes of anterior and posterior L2 cells. Number of cells: 1,175 ≤ n ≤ 1,352. Scale bars: 20 µm.

