Figure 8.
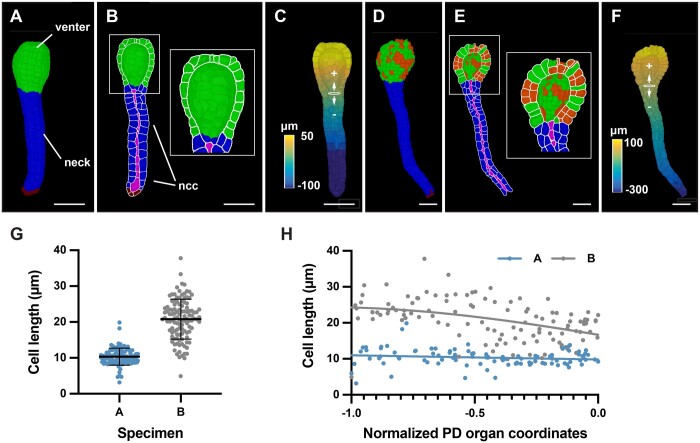
Cellular analysis of 3D digital archegonia from Marchantia. A–C and D–F, 3D cell meshes of two different-stage archegonia are depicted. A, Specimen A. The venter and neck are indicated. B, An about mid-sagittal section through the venter. A view of the sectioned cells and the interior of one half of the venter is depicted. The outlines of the sectioned cells are indicated in white. The neck canal cells are highlighted in purple. C, Distance values along the central axis. The Bezier ring at the venter-neck boundary, which serves as the origin of the coordinate system, is indicated (B). D, Specimen B. Cells having undergone periclinal cell divisions are marked in orange. E, Highlighted white box represents the zoom view of the venter. The neck canal cells are highlighted in purple. F, Distance values along the central axis. The Bezier ring at the venter-neck boundary, which serves as the origin of the coordinate system, is indicated. G, Graph depicting the cell lengths of all neck cells of specimens (A) and (B). The mean ± sd is indicated. Specimen A: n = 98. Specimen B: n = 114. H, Graph showing cell length of individual neck cells of the two specimens shown in (C) in relation to their normalized position along the long axis of the neck. The tip of the neck is oriented to the left (0.0 corresponds to the ring position, the tip of the neck is at position −1.0, compare with Figure 8B). Abbreviations: ncc, neck canal cells; PD, proximal-distal. Scale bars: (A–F) 50 µm.

