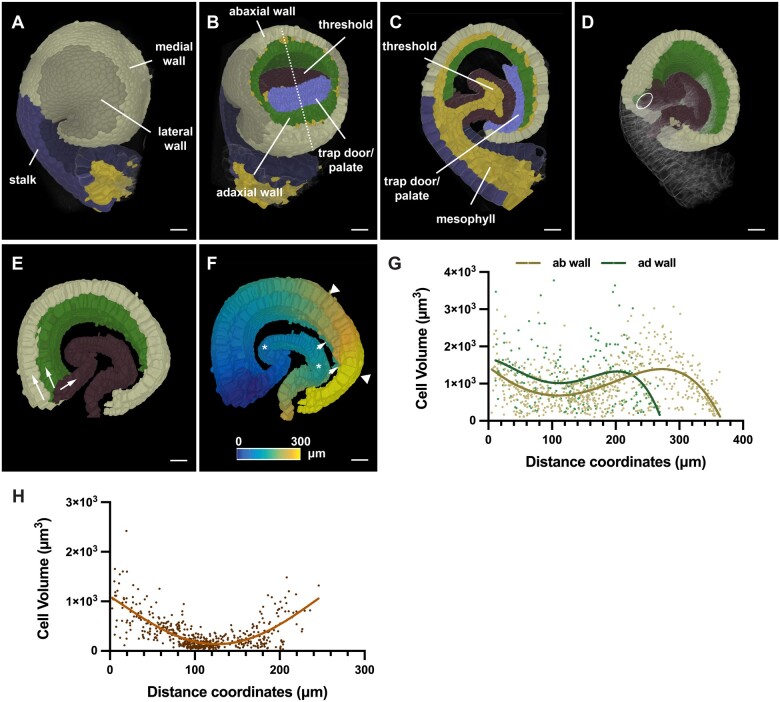
Figure 9.
3D digital Utricularia trap. A specimen 6 d after initiation is shown. A, Side view of the 3D cell mesh with annotation of various tissues. B, Tilted view of (A) with part of the wall removed by a tangential clipping plane. The dashed line indicates the mid-sagittal section shown in (C). C, Mid-sagittal section. D, Slanted 3D view of (A) with half of the trap cut off at the mid-sagittal plane shown in (B). The trap door and palate domain were removed. The position of the Bezier ellipsoid is indicated. E, Arrows indicate the direction of the distance coordinates through the epidermis of the abaxial and adaxial tissue of the wall and the threshold, respectively. F, Heat map indicating distances. Wall and threshold are treated separately. Triangles mark the 240–320 µm interval of the abaxial wall. Arrows highlight the tapering end of the adaxial wall. Asterisks indicate the 80- to 150-µm interval of the threshold. G, Graph displaying cell volume of epidermal trap cells in relation to their position. Values for the abaxial (ab) and adaxial (ad) wall are superimposed. The respective nonlinear regression curves fitting a fourth order polynomial function are indicated. ab wall: n = 786, ad wall: n = 231. H, Graph displaying cell volume of threshold cells in relation to their position. The line marks a nonlinear regression curve. n = 533. Scale bars: 20 µm.

