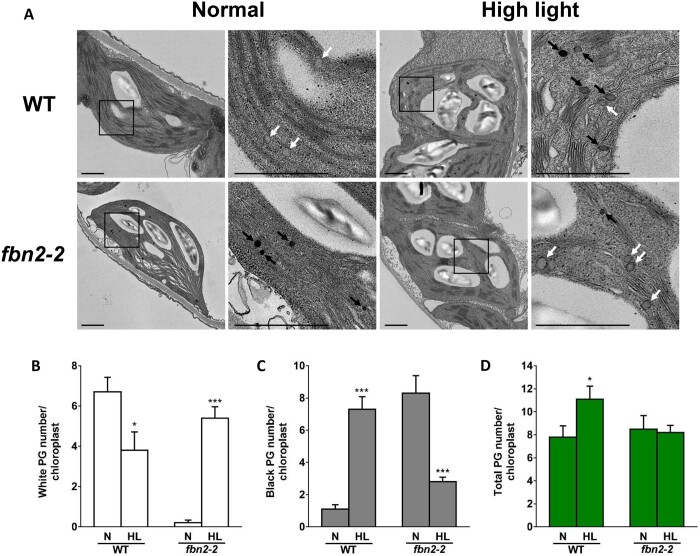
Figure 6.
Transmission electron micrograph of chloroplasts in the WT and fbn2 mutants. A, Chloroplast of WT and fbn2-2 mutant leaf stained with osmium tetroxide. White or black arrows indicate nonosmiophilic or osmiophilic PGs. Scale bar = 1 μm. B–D, The numbers of nonosmiophilic (white) or osmiophilic (black) PGs and total PGs per chloroplast. 10 chloroplasts were counted from each leaf of three plants. Data represent means with SEM from independent samples (n = 10). Statistically significant differences from the WT are indicated by t test (*P < 0.05, ***P < 0.001). N, normal; HL, high light.

