Figure 1.
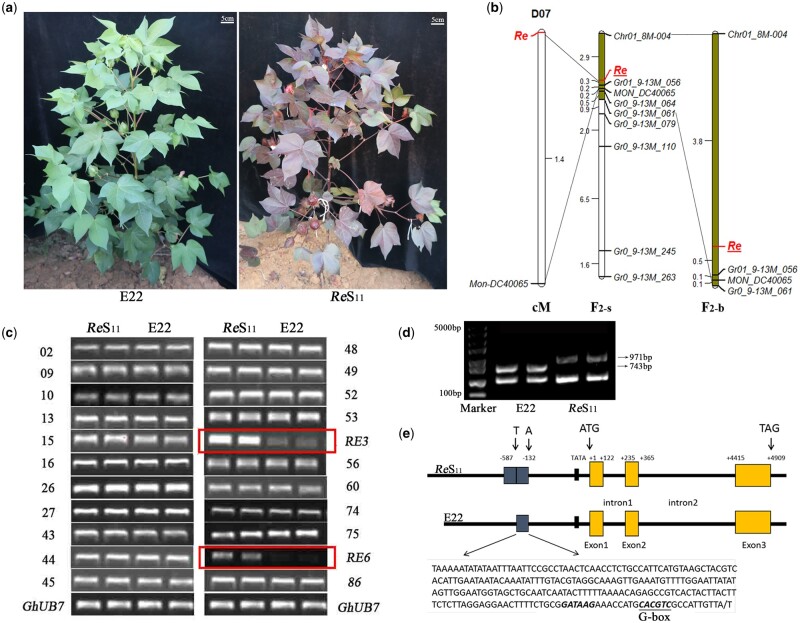
Map-based cloning of Re. A, Field photos of E22 and ReS11.ReS11 showed a red color in the main tissues, except for the fiber. B, Linkage mapping of Re. The F2-s population contained 318 F2 recessive plants obtained in 2013 and 2014. The F2-b population contained a total of 1,898 F2 recessive plants obtained in 2013, 2014, and 2015. C, Expression analysis of some candidate genes in the interval by RT-PCR. Two genes, RE3 and RE6, showed differences in expression. GhUB7 was used as an internal control gene. D, Large fragment differences were detected in the Re promoter region. The small fragment below represents a homologous amplified sequence. E, Schematic diagram of the structure of Re between E22 and ReS11. A 288-bp duplication was identified upstream of the start codon of Re in ReS11, and a G-box was identified in the repetitive fragment.

