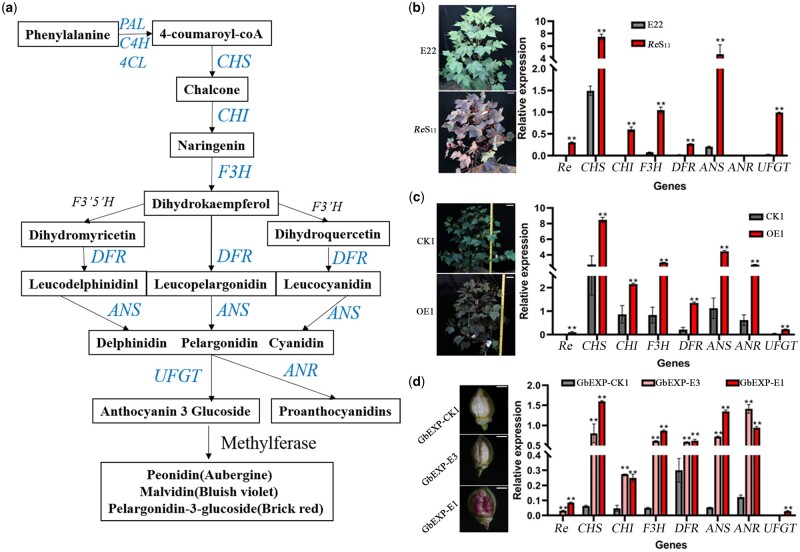
Figure 4.
Expression levels of the main genes in the anthocyanin synthesis pathway. A, Schematic diagram of the main pathways of anthocyanin metabolism in plants drawn based on existing research (Koes et al., 2005). B, The expression of six structural genes, except ANR, was significantly higher in ReS11 than in E22. Field photos of E22 and ReS11 are on the left, and the scale bar represents 10 cm. C, Seven structural genes in OE1 showed significantly higher expression than in CK1. Field photos of CK1 and OE1 are on the left, and the scale bar represents 10 cm. D, The expression of seven structural genes in 5 DPA fibers of three transformed lines driven by fiber-specific promoters. Six structural genes, except UFGT, in GbEXP-E3 and GbEXP-E1 showed significantly higher expression than in GbEXP-CK1, and UFGT only showed significantly increased expression in GbEXP-E1. Five DPA Fiber photos of three transformed lines are on the left, and the scale bar represents 5 mm. The relative expression level was obtained by RT-qPCR. For (B–D), error bars represent ±sd (three biological replicates), and the statistical significance was calculated using a t test (**P < 0.01, *P < 0.05).

