Figure 5.
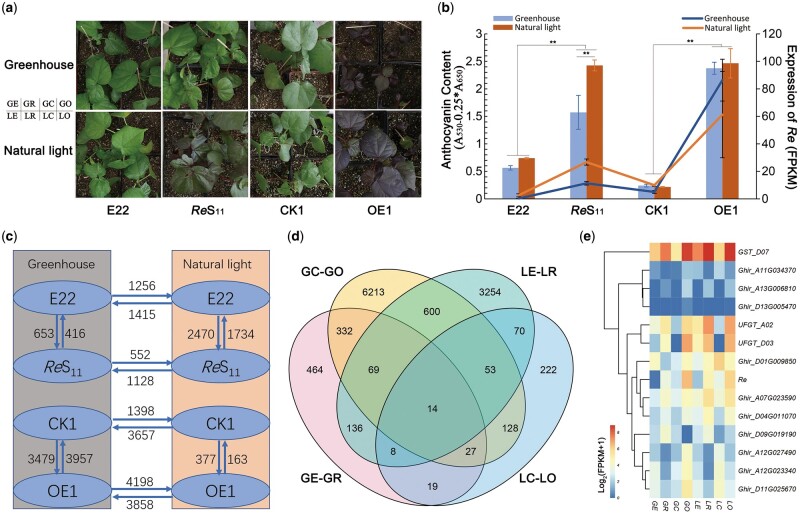
Light affects Re expression and anthocyanin accumulation. A, Leaf colors of ReS11, E22, CK1 and OE1 under greenhouse and natural light conditions. ReS11 leaves turned green under greenhouse conditions. B, Re expression and relative anthocyanin content of leaves of four lines in two environments. The bar graph represents the relative content of anthocyanin, and the broken line graph represents the relative expression of Re. Error bars represent ±sd (three biological replicates), and the statistical significance was calculated using a t test (**P < 0.01). C, DEG numbers between pairwise comparisons. The pointing of the arrow represents increased expression, and the number represents the DEGs. D, Venn diagram of overlapping DEGs between GC–GO, LE–LR, GE–GR, and LC–LO. In which, “G, L” represent “greenhouse” and “natural light” conditions, respectively; “R, E, C, O” represent ReS11, E22, CK1, and OE1, respectively. E, Heatmap of the expression levels of the 14 overlapping DEGs.

