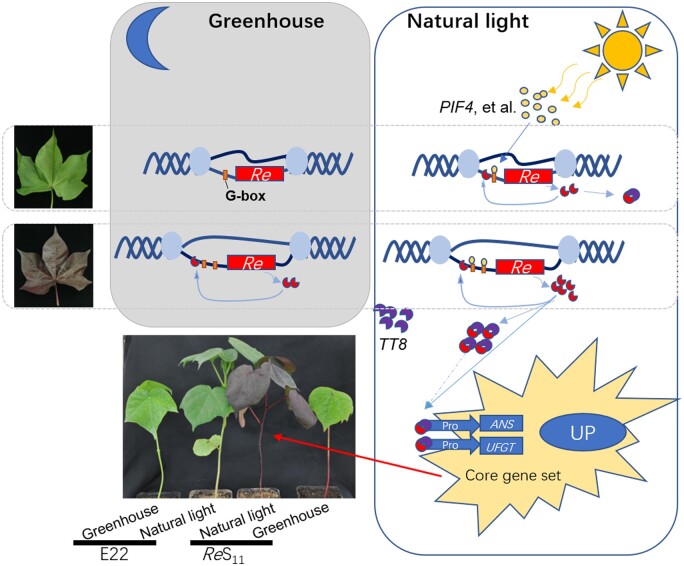
Figure 7.
Regulation model of Re. The box on the left represents the greenhouse condition, and the box on the right represents the natural light condition. Different shapes and colors represent gene structure or transcription products, as shown in the figure. The solid line represents the identified pathway, and the dashed line represents the inferred pathway.

