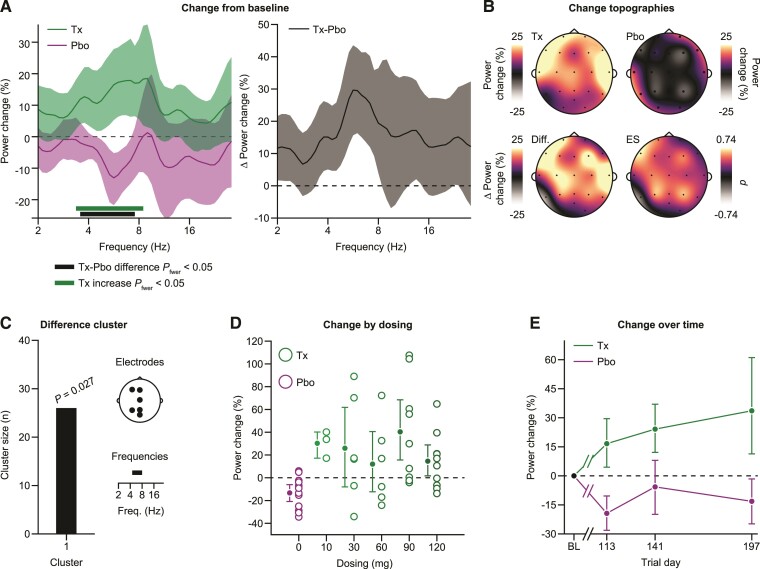
Figure 3.
Treatment with tominersen induces an increase in EEG activity. (A) Left: comparison of the change from baseline in EEG activity between patients who received tominersen treatment (green) and patients who received placebo (purple). A significant cluster of neighbouring differences (P = 0.021, cluster-based permutation test, family-wise error rate corrected) between treated (n = 34) and placebo (n = 12) patients as well as a cluster of neighbouring frequencies with significantly increased EEG activity in the treatment cohort (P = 0.003, cluster-based permutation test, family-wise error rate corrected) are shown as a thick lines. Right: Same data are displayed as the difference in the change from baseline between treated and placebo patients. All error bars reflect bootstrap estimates of the 95% confidence interval. (B) Topographies of the change in power from baseline averaged across the frequencies with cohort differences shown separately for the treatment and placebo patients. The bottom row topographies display the difference between the cohorts and the associated Cohen’s d as an estimate of ES. (C) Cluster size, associated P-value (random permutation test) and contributing electrodes, and frequencies for the difference cluster between treatment and placebo patients when data are not averaged across electrodes for each patient but the analysis is performed in the full frequency by electrode space. (D) Change of EEG activity from baseline by dosing levels. E) Change of EEG activity from baseline separately for the three post-treatment visits. For (D) and (E), we averaged the change in power from baseline within the significant cluster of differences between treatment and placebo patients, detected when performing the analysis in the full electrode-by-frequencies space (C). Pbo = placebo, Tx = treatment.

