Figure 1.
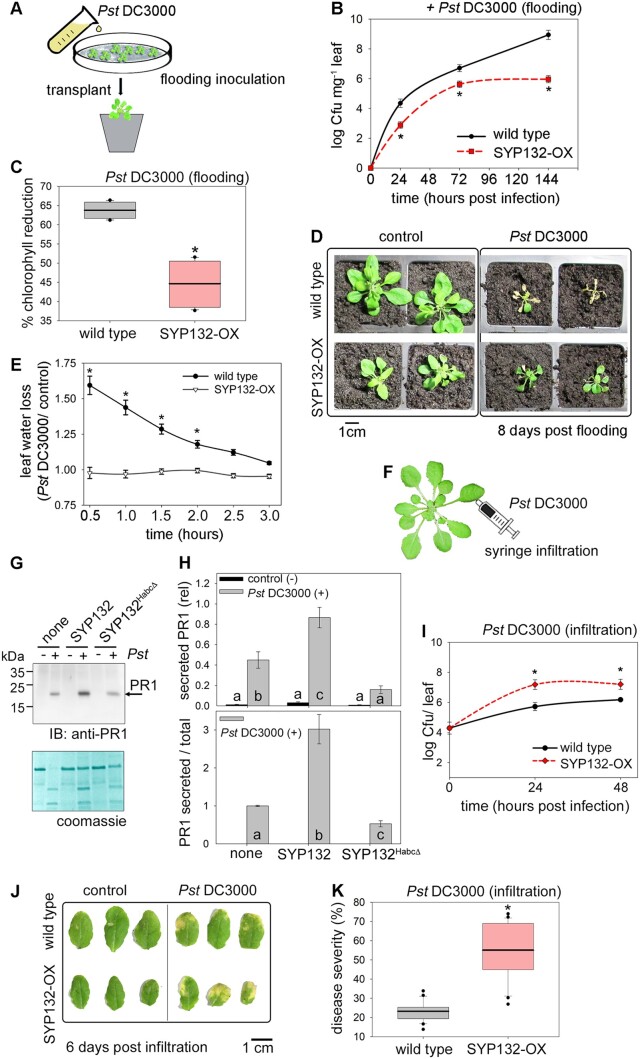
SYP132 promotes stomatal defenses but compromises postinfection immunity (also see Supplemental Figure S1). A, Schematic for flood-inoculation of plants with bacterial pathogens for infection via stomatal route. B, Mean ± se Cfu mg−1 in wild-type and pCaMV 35S: RFP-SYP132 Arabidopsis over-expressing SYP132 (SYP132-OX) flood-inoculated with Pst DC3000 inoculum at 5 × 10⁷ Cfu mL−1 measured at 24-h Figure 1 (continued) intervals postinfection for 144 h and plotted on a logarithmic scale. Statistically significant differences assessed using Mann–Whitney–Wilcoxon test are indicated with “*” for each timepoint (P < 0.01), N ≥ 3 independent experiments with ≥9 plants. C, Wild-type and SYP132-OX Arabidopsis were flood-inoculated with pathogens Pst DC3000 at 5 × 10⁷ Cfu mL−1 or 10 mM MgCl2, 0.025% v/v Silwet-L77 buffer (control). Box plots with error bars depict percent reduction in chlorophyll pigments for pathogen challenged leaves relative to buffer. Thin horizontal lines represent the median, bold horizontal lines represent the mean, box limits show the 25th and 75th percentiles. Outliers that exceed their whisker range (1.5× interquartile range) are represented by dots. Statistically significant differences assessed using Mann–Whitney–Wilcoxon test are indicated with “*” (P < 0.001), N = 3, using ≥6 plants per each experiment. Note: horizontal lines for mean and median are overlapped. D, Representative photographs of wild-type and SYP132-OX Arabidopsis flood-inoculated with buffer (control) or Pst DC3000 inoculum at 5 × 10⁷ Cfu mL−1 and grown on soil for 8 d are shown. Images are aligned digitally for comparisons. N = 3. Scale bar = 1 cm (accurate for each image). E, Mean ± se values for leaf water loss over time (hours), in leaf dehydration assays on excised leaves from wild-type and SYP132-OX Arabidopsis. Leaf water loss was calculated as change in leaf weight due to dehydration following treatment with Pst DC3000 relative to buffer (control). Statistically significant differences assessed using Mann–Whitney–Wilcoxon test are indicated with “*” (P < 0.001), N ≥ 3. Data are from ≥9 plants and ≥6 measurements in each experiment. F, Schematic for bacterial infection of leaves by syringe infiltration bypassing stomata. G, Representative immunoblot shows PR1 band at ∼20 kDa detected using anti-PR1 antibodies (top panel) of apoplast flush derived from N. benthamiana leaves treated with buffer (control) or with Pst DC3000 in buffer for 48 h. Leaves were untransformed (none), or transiently transformed to express RFP-fused to the full length SYP132 (SYP132) or to the dominant negative, so-called Sp3-fragment (SYP132HabcΔ). The Coomassie-stained membrane (bottom panel) shows total protein per lane. Note, the nature of the upper band in the Coomassie is unknown, but the pattern appeared in every experiment). Black lines (left) indicate position of molecular mass markers, and black arrows (right) indicate expected band positions. PR1 and SNARE expression was verified by corresponding immunoblot analysis of total leaf tissue (see Supplemental Figure S1H). H, Graphs for mean ± se for secreted PR1 in apoplast flush normalized to total protein in each lane (upper panel), and for secreted PR1 relative to total PR1 in the pathogen treated samples (lower panel). Black bars represent data from control (buffer, − Pst DC3000), and grey bars represent data from Pst DC3000 (+) infected leaves. Letters indicate statistically significant differences assessed using ANOVA (P < 0.001), N = 3 with ≥6 plants in each experiment. I, Pst DC3000 population in wild-type or SYP132-OX Arabidopsis following infiltration with 10 μL Pst DC3000 inoculum at 2.5 × 10⁵ Cfu mL−1. Graphs are mean ± sePst DC3000 Cfu per leaf plotted on a logarithmic scale over hour (s) postinfection. Statistically significant differences assessed using Mann–Whitney–Wilcoxon test are indicated with “*” after comparing Cfu counts for different Arabidopsis lines at each timepoint (P < 0.001), N = 3 with ≥6 plants in each experiment. J, Representative photographs of wild-type and SYP132-OX Arabidopsis infiltrated with 10 μL Pst DC3000 inoculum at 2.5 × 10⁵ Cfu mL−1 or buffer (control) at 0 and 96 h postinfection are shown. Images are aligned digitally. N = 3. Scale bar = 1 cm (accurate for each image). K, Box plot with error bars depicting % disease severity in wild-type and SYP132-OX Arabidopsis after 72 h following infiltration with 10 μL Pst DC3000 inoculum at 2.5 × 10⁵ Cfu mL−1. Thin horizontal lines represent the median, bold horizontal lines represent the mean, box limits show the 25th and 75th percentiles. Outliers that exceed their whisker range (1.5× interquartile range) are represented by dots. “*” indicates statistical significance using Mann–Whitney–Wilcoxon test (P < 0.01), N = 3 with ≥6 plants in each experiment. Note: horizontal lines for mean and median are overlapped.

