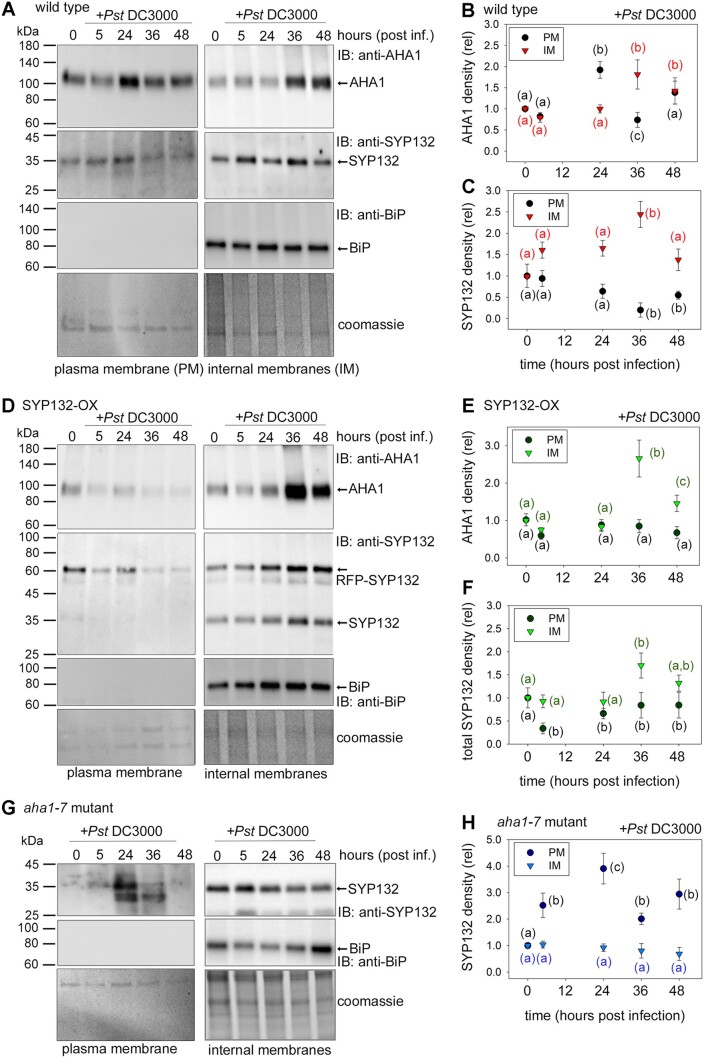
Figure 2.
Time-sensitive changes in AHA1 and SYP132 localization occur during bacterial pathogenesis (also see Supplemental Figures S2 and S3). A, D, and G, Immunoblot analysis of Arabidopsis PM and IM fractions resolved using SDS-PAGE following infiltration with 10 μL Pst DC3000 inoculum at 2.5 × 10⁵ Cfu mL−1 in buffer (10 mM MgCl2), at different hours postinfection. Native AHA1 at ∼100 kDa (first panels) was detected using anti-AHA1 antibodies, and total SYP132 was detected at ∼35 kDa for native SYP132, and at ∼61 kDa RFP-SYP132 (second panels) using anti-SYP132 antibodies. Lumen-BiP at ∼74 kDa (third panels), a marker for IMs was detected using anti-BiP antibodies. Representative immunoblots of Figure 2 (continued) PM and IM fractions from wild-type Arabidopsis (A), pCaMV 35S: RFP-SYP132 Arabidopsis over-expressing SYP132 (SYP132-OX) (B) and Arabidopsis aha1-7 mutant (C) are shown. Purity of the PM fractions was estimated at >99% using BiP bands as reference. Total protein was detected using Coomassie stained immunoblot membrane (fourth panels) and used for quantitative analysis. Black lines (left) indicate positions of molecular mass markers, and black arrows (right) indicate expected band positions. B, C, E, F, and H, Mean ± se protein levels for each time point (hours postinfection) in different Arabidopsis lines. Plots include protein densities in PM (circles) and IMs (triangles) in Arabidopsis; wild-type plants AHA1 (B), SYP132 (C), SYP132-OX lines AHA1 (E), total SYP132, adding native and RFP-SYP132 (F), and aha1-7 mutant plants SYP132 (H). Values were obtained from densitometric analysis of immunoblots, normalized total protein detected using Coomassie stain, relative to buffer treated control (time = 0). Letters denote statistically significant differences determined using ANOVA (P < 0.05), N ≥ 3, with ≥6 plants for each timepoint, per experiment. Note: About 10-fold more total protein was loaded for IM fractions than for PM fractions, precluding a direct comparison between PM and IM samples.

